Calculating Exceedance Values for Specified Recurrence Intervals
After choosing to plot exceedance values for a certain variable (e.g. water level) to a longitudinal profile plot, the user must provide the wanted recurrence interval as part of the plot specification.
The program calculates exceedance values by linear interpolation between the first available shorter recurrence interval and the first longer recurrence interval (see example below):
Number of years simulated: 15
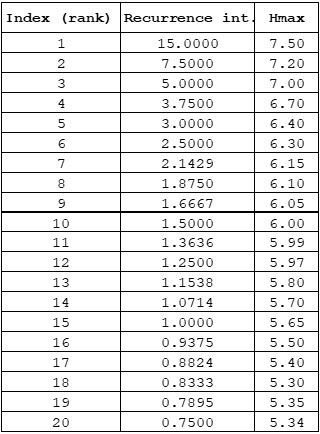
Exceedance value for 10 years recurrence interval is calculated as (i.e. interpolation between values for the 7.5 and 15 recurrence intervals):