Measurement Stations
Measurement stations representing locations of flow gauges, pressure meters etc. can be defined in MIKE+ for any model type.
The stations can be viewed on the main Map, providing the user with an overview of monitoring locations. Additional information such as image and description of the monitoring site can be defined for individual stations.
It is possible to insert a measurement station graphically on the map using the ‘Measurement stations’ target layer, as well as in the editor, using the ‘Insert’ button. Note that adding a measurement station from the editor locates by default the feature in the upper right corner of the current Map view.
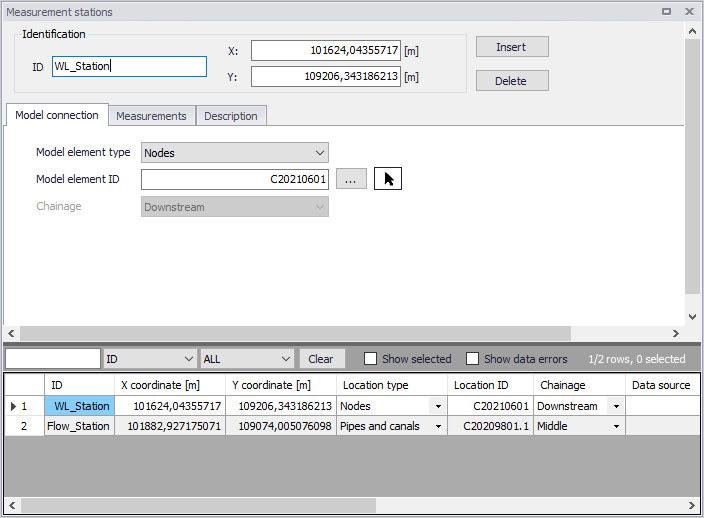
Figure: Measurement Stations editor
To relocate a feature, the X and Y coordinates may be modified in the editor, or the Edit tool from the Edit Feature toolbox in the ribbon may also be used to graphically move the feature on the Map.
Model Connection
In order to link the measurement station with a modelling location, the stations need to be connected to the model network.
Define the connection of the measurement stations in the Model Connection tab of the Measurement Stations Editor.
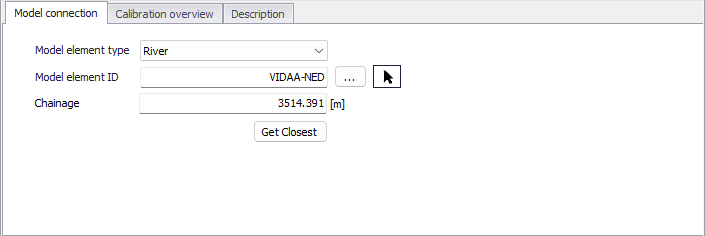
Figure: Model Connection tab on the Measurement Stations editor
The '…' button after 'Model Element ID' edit box opens a selection list depending on the selected 'Model Element Type'. The arrow button allows one to pick a Node/Junction/Link/Pipe/River on the map depending on the selected Model Element Type. For stations connected to CS links, specify the chainage or computational grid point of the connection as Upstream, Middle or Downstream of the link. For stations connected to rivers, specify the chainage value of the connection.
Note
Connection lines between stations and the network are displayed on the Map after model connections are specified.
Also, on the Map View, the 'Connect station' tool from the 'Layer editing tools' toolbar may be used to connect stations to network elements. Activate the tool, click on a station feature to connect on the Map, and then select the network element to which to connect.
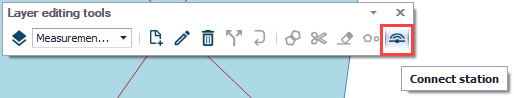
Figure: Layer editing tools on the Map
Connection Tool

For automatic (in-bulk) connection of measurement stations to the model network, use the Connection Tool accessed via the CS/WD Toolbox on the CS/WD Network menu ribbon.
This will launch the Connection Tool, which is also used for connecting catchments, load allocations and demands. The tool will generate station connections to the network.
The tool works either on selected or all measurement stations. With the Connection Tool, the m_Station.Chainage will be set to 'Downstream' for CS link connections. The reason for this is that flow gauges are most likely located in the 'Downstream' end of pipe. The grid point location may still be modified in the editor afterwards.
Calibration overview
This tab shows a summary with the main calibration statistics, for all the calibration plots associated to the current station.
This provides an overview of the calibration results for each station, for example when different calibration plots need to be used in relation with different result files. So, this is especially relevant to compare the calibration results from different scenarios, or from different flood events.
Clicking the 'Edit' button in the last column of the table will open the selected calibration plot.
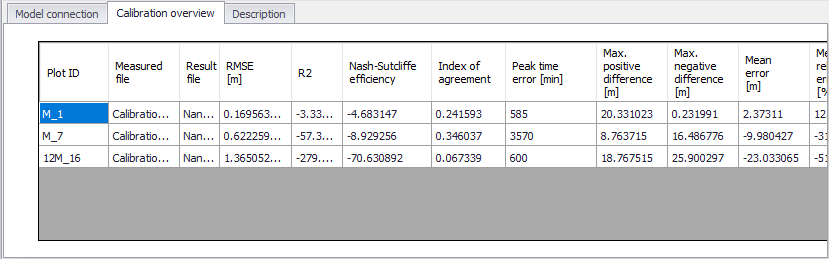
Figure: The 'Calibration overview' tab on the Measurement Stations editor
Description
In this tab, optional information about the measurement station may be added. An image associated with the station record may also be uploaded.
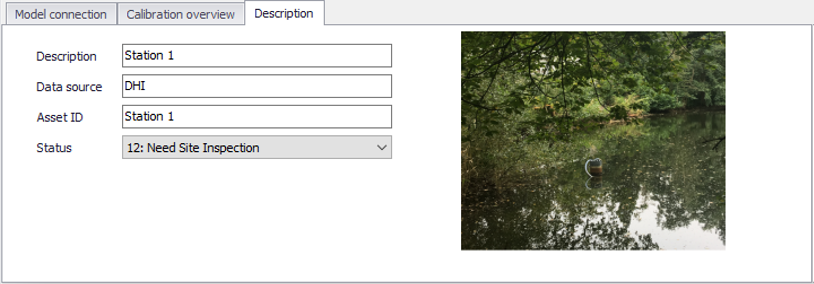
Figure: The Description tab on the Measurement Stations editor