Climatology
Climate-related variables used for computing runoff and snowmelt are defined in the Climatology editor.
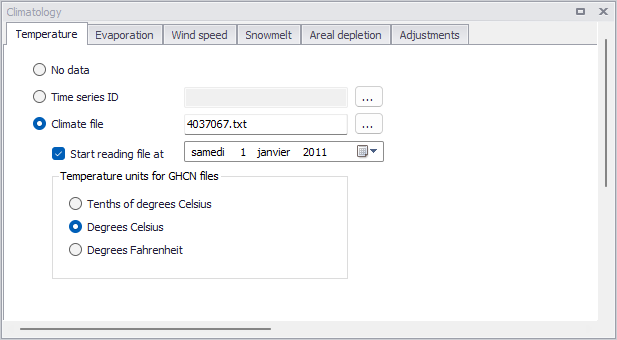
Figure: The Climatology editor for SWMM models
The editor organizes climatological data into the following groups:
- Temperature
- Evaporation
- Wind Speed
- Snowmelt
- Areal Depletion
- Adjustments
Temperature
Temperature data are used when simulating snowfall and snowmelt processes during runoff calculations. If these processes are not being simulated then no temperature data are needed.
Temperature data can be supplied from one of the following sources:
- A time series from the 'Time series' editor in the current project (values at intermediate times are found by interpolation)
- An external climate file. The following file formats are recognized:
- Global Historical Climatology Network - Daily (GHCN-D) files, in text output format, available from NOAA's National Centers for Environmental Information (NCEI) Climate Data Online service
- Older NCEI DS3200 or DS3210 files
- Canadian climate files available from Environment Canada
- A user-defined climate file where each line contains the recording station name, the year, month, day, maximum temperature, minimum temperature, and optionally, evaporation rate, and wind speed. If no data are available for any of these items on a given date, then an asterisk should be entered as its value.
When using a NOAA-GHCN climate file, the unit of temperature data in the file must also be selected..
For user-defined climate files, the following units must be used in the file when the project is in SI unit system:
- Temperatures in degrees C
- Evaporation in mm/day
- Wind speed in km/hour
The following units must be used when the project is in US unit system:
- Temperatures in degrees F
- Evaporation in inches/day
- Wind speed in miles/hour.
Figure: The SWMM Climatology Temperature tab
| Edit field | Description | Used or required by simulations | Field name in datastructure |
|---|---|---|---|
| Radio button for temperature data type | Yes | TypeNo | |
| No Data | No temperature data | Yes if TypeNo = 1 | |
| Time Series ID | Temperature data read from time series defined in Time Series editor | Yes if TypeNo = 2 | TimeSeriesID |
| Climate File | Temperature data read from NCDC *.DAT file | Yes if TypeNo = 3 | FileName |
| Start Reading File at | Start date for reading from NCDC data file | Yes if TypeNo = 3 | StartDate |
| Temperature units for GHCN files | Units of temperature values, when using an external NOAA-GHCN climate file | Yes if using an external NOAA-GHCN climate file | TempUnit |
Table: Edit fields in the Temperature tab (mss_Temperature)
Evaporation
Evaporation can occur for standing water on catchment surfaces, for subsurface water in groundwater aquifers, and from water held in storage units. Evaporation rates can be defined as:
- A single constant value
- A set of monthly average values
- User-supplied time series of daily values
- Daily values read from a NCDC climate file
- Values computed from the daily temperatures in the external climate file
If a NCDC file is used, then a set of monthly pan coefficients should also be supplied to convert the pan evaporation data to free water surface values.
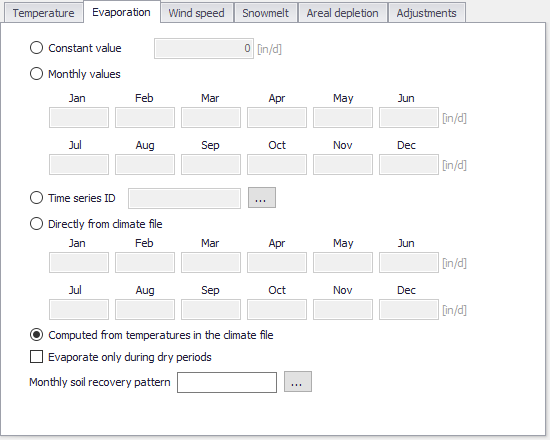
Figure: The Climatology Evaporation tab
| Edit field | Description | Used or required by simulations | Field name in datastructure |
|---|---|---|---|
| Radio button for evaporation data type | Yes | TypeNo | |
| Constant Value | Evaporation is set to constant value TypeNo = 1 | Yes if TypeNo = 1 | ConstValue |
| Monthly Values TypeNo = 2 | |||
| Jan | Monthly evaporation value for January entered by user | Yes if TypeNo = 2 | Value1 |
| Feb | Monthly evaporation value for February entered by user | Yes if TypeNo = 2 | Value2 |
| Mar | Monthly evaporation value for March entered by user | Yes if TypeNo = 2 | Value3 |
| Apr | Monthly evaporation value for April entered by user | Yes if TypeNo = 2 | Value4 |
| May | Monthly evaporation value for May entered by user | Yes if TypeNo = 2 | Value5 |
| June | Monthly evaporation value for June entered by user | Yes if TypeNo = 2 | Value6 |
| July | Monthly evaporation value for July entered by user | Yes if TypeNo = 2 | Value7 |
| Aug | Monthly evaporation value for August entered by user | Yes if TypeNo = 2 | Value8 |
| Sept | Monthly evaporation value for September entered by user | Yes if TypeNo = 2 | Value9 |
| Oct | Monthly evaporation value for October entered by user | Yes if TypeNo = 2 | Value10 |
| Nov | Monthly evaporation value for November entered by user | Yes if TypeNo = 2 | Value11 |
| Dec | Monthly evaporation value for December entered by user | Yes if TypeNo = 2 | Value12 |
| Time Series ID | Evaporation data read from time series defined in Time Series editor | Yes if TypeNo = 3 | TimeSeriesID |
| Directly from Climate File TypeNo = 4 | |||
| Jan | Evaporation data for January read from NCDC file | Yes if TypeNo = 4 | Pan1 |
| Feb | Evaporation data for February read from NCDC file | Yes if TypeNo = 4 | Pan2 |
| Mar | Evaporation data for March read from NCDC file | Yes if TypeNo = 4 | Pan3 |
| Apr | Evaporation data for April read from NCDC file | Yes if TypeNo = 4 | Pan4 |
| May | Evaporation data for May read from NCDC file | Yes if TypeNo = 4 | Pan5 |
| June | Evaporation data for June read from NCDC file | Yes if TypeNo = 4 | Pan6 |
| July | Evaporation data for July read from NCDC file | Yes if TypeNo = 4 | Pan7 |
| Aug | Evaporation data for August read from NCDC file | Yes if TypeNo = 4 | Pan8 |
| Sept | Evaporation data for September read from NCDC file | Yes if TypeNo = 4 | Pan9 |
| Oct | Evaporation data for October read from NCDC file | Yes if TypeNo = 4 | Pan10 |
| Nov | Evaporation data for November read from NCDC file | Yes if TypeNo = 4 | Pan11 |
| Dec | Evaporation data for December read from NCDC file | Yes if TypeNo = 4 | Pan12 |
| Computed from Temperatures in the Climate Files | Evaporation calculated based on temperature in the climate file | Yes if TypeNo = 5 | |
| Evaporate Only During Dry Periods | Option for setting evaporation to occur only during dry periods | Yes | DryOnlyNo |
| Monthly Soil Recovery Pattern | Monthly infiltration recovery rate pattern defined in Time Patterns editor | Yes | SoilRecoveryPatternID |
Table: Edit fields in the Evaporation tab (mss_Evaporation)
Wind Speed
Wind speed is an optional climatological variable that is only used for snowmelt calculations. Define either a set of monthly average speeds, or wind speed data from the same NCDC climatological file used for daily min/max temperatures.
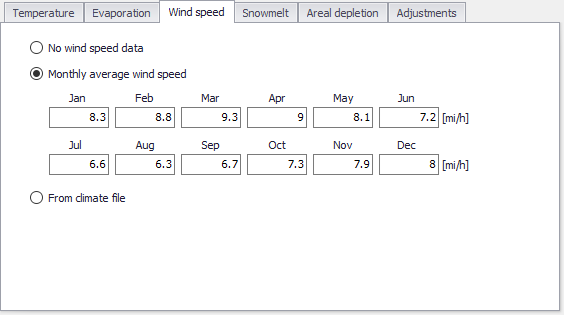
Figure: The Climatology Wind Speed tab
| Edit field | Description | Used or required by simulations | Field name in datastructure |
|---|---|---|---|
| Radio button for data type | Yes | WindSpeedTypeNo | |
| No WindSpeed Data | No Windspeed data should be used | Yes if WindSpeedTypeNo = 1 | |
| Monthly Average Wind Speed WindSpeedTypeNo = 2 | |||
| Jan | Monthly evaporation value for January entered by user | Yes if WindSpeedTypeNo = 2 | Value1 |
| Feb | Monthly evaporation value for February entered by user | Yes if WindSpeedTypeNo = 2 | Value2 |
| Mar | Monthly evaporation value for March entered by user | Yes if WindSpeedTypeNo = 22 | Value3 |
| Apr | Monthly evaporation value for April entered by user | Yes if WindSpeedTypeNo = 2 | Value4 |
| May | Monthly evaporation value for May entered by user | Yes if WindSpeedTypeNo = 2 | Value5 |
| June | Monthly evaporation value for June entered by user | Yes if WindSpeedTypeNo = 2 | Value6 |
| July | Monthly evaporation value for July entered by user | Yes if WindSpeedTypeNo = 2 | Value7 |
| Aug | Monthly evaporation value for August entered by user | Yes if WindSpeedTypeNo = 2 | Value8 |
| Sept | Monthly evaporation value for September entered by user | Yes if WindSpeedTypeNo = 2 | Value9 |
| Oct | Monthly evaporation value for October entered by user | Yes if WindSpeedTypeNo = 2 | Value10 |
| Nov | Monthly evaporation value for November entered by user | Yes if WindSpeedTypeNo = 2 | Value11 |
| Dec | Monthly evaporation value for December entered by user | Yes if WindSpeedTypeNo = 2 | Value12 |
| From Climate File | WindSpeed data read from the NCDC data file which is specified on the Temperature tab page | Yes if WindSpeedTypeNo = 3 |
Table: Edit fields in the Wind Speed tab (mss_Temperature)
Snowmelt
Snowmelt parameters are climatological variables that apply across the entire model area when simulating snowfall and snowmelt. They include:
- The temperature at which precipitation falls as snow
- Heat exchange properties of the snow surface
- Study area elevation, latitude, and longitude correction
For additional information on Snowfall and Snowmelt processes please consult the section on Snowpacks.
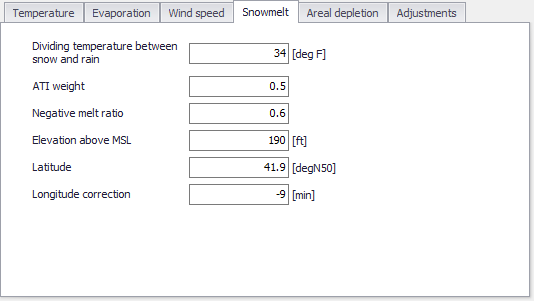
Figure: The Snowmelt tab page on the Climatology editor
| Edit field | Description | Used or required by simulations | Field name in datastructure |
|---|---|---|---|
| Dividing Temperature Between Snow and Rain (degrees F) | Temperature below which precipitation falls as snow | Yes | SnowTemp |
| ATI Weight | This parameter reflects to what degree heat transfer within a snowpack during non-melt periods is affected by prior air temperatures. Smaller values reflect a thicker surface layer of snow which result in reduced rates of heat transfer. Values must be between 0 and 1.The default value is 0.5. | Yes | Atiwt |
| Negative Melt Ratio | This is the ratio of the heat transfer coefficient of a snowpack during non-melt conditions to the coefficient during melt conditions. It must be a number between 0 and 1. The default value is 0.6. | Yes | Rnm |
| Elevation Above MSL (feet) | Enter the average elevation above mean sea level for the study area, in feet or meters. This value is used to provide a more accurate estimate of atmospheric pressure. The default is 0.0, which results in a pressure of 29.9 inches Hg. The effect of wind on snowmelt rates during rainfall periods is greater at higher pressures, which occur at lower elevations. | Yes | Elev |
| Latitude (degrees North) | Enter the latitude, in degrees North, of the study area. This number is used when computing the hours of sunrise and sunset, which in turn are used to extend min/max daily temperatures into continuous values. The default is 50 degrees North. | Yes | Lat |
| Longitude Correction (minutes) | This is a correction, in minutes of time, between true solar time and the time on clocks. It depends on a location's longitude (q) and the standard meridian of its time zone (SM) through the expression 4 (q-SM). This correction is used to adjust the hours of sunrise and sunset when extending daily min/max temperatures into continuous values. The default value is 0 | Yes | Dtlong |
Table: Edit fields in the Snowmelt tab (mss_Temperature)
Areal Depletion
Areal Depletion refers to the tendency of snow to melt nonuniformly over the surface of a catchment. As the melting process proceeds, the area covered by snow is reduced. This behaviour can be described by an Areal Depletion Curve. It plots the fraction of total area that remains snow covered against the ratio of the actual snow depth to the depth at which there is 100% snow cover. A typical ADC for a natural area is shown below.
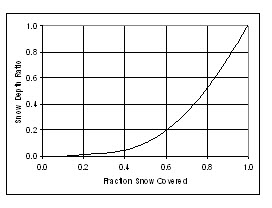
Figure: Example Areal Depletion Curve
Two such curves can be supplied; one for impervious areas and another for pervious areas.
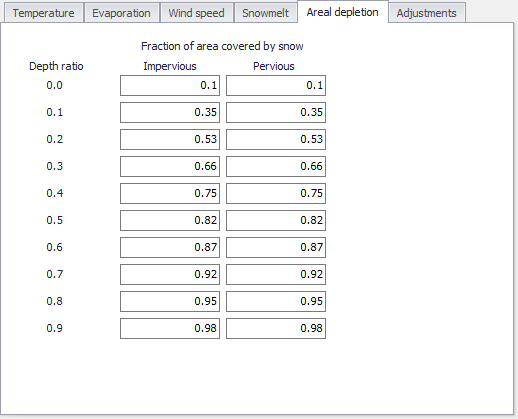
Figure: The SWMM Areal Depletion tab
| Edit field | Description | Used or required by simulations | Field name in datastructure |
|---|---|---|---|
| Impervious | |||
| 0.0 | Fraction of impervious area covered by snow at interval [0.0-0.1] | Yes | AdcImPerv0 |
| 0.1 | Fraction of impervious area covered by snow at interval ]0.1-0.2] | Yes | AdcImPerv1 |
| 0.2 | Fraction of impervious area covered by snow at interval ]0.2-0.3] | Yes | AdcImPerv2 |
| 0.3 | Fraction of impervious area covered by snow at interval ]0.3-0.4] | Yes | AdcImPerv3 |
| 0.4 | Fraction of impervious area covered by snow at interval ]0.4-0.5] | Yes | AdcImPerv4 |
| 0.5 | Fraction of impervious area covered by snow at interval ]0.5-0.6] | Yes | AdcImPerv5 |
| 0.6 | Fraction of impervious area covered by snow at interval ]0.6-0.7] | Yes | AdcImPerv6 |
| 0.7 | Fraction of impervious area covered by snow at interval ]0.7-0.8] | Yes | AdcImPerv7 |
| 0.8 | Fraction of impervious area covered by snow at interval ]0.8-0.9] | Yes | AdcImPerv8 |
| 0.9 | Fraction of impervious area covered by snow at interval ]0.9-1.0] | Yes | AdcImPerv9 |
| Pervious | |||
| 0.0 | Fraction of pervious area covered by snow at interval [0.0-0.1] | Yes | AdcPerv0 |
| 0.1 | Fraction of pervious area covered by snow at interval ]0.1-0.2] | Yes | AdcPerv1 |
| 0.2 | Fraction of pervious area covered by snow at interval ]0.2-0.3] | Yes | AdcPerv2 |
| 0.3 | Fraction of pervious area covered by snow at interval ]0.3-0.4] | Yes | AdcPerv3 |
| 0.4 | Fraction of pervious area covered by snow at interval ]0.4-0.5] | Yes | AdcPerv4 |
| 0.5 | Fraction of pervious area covered by snow at interval ]0.5-0.6] | Yes | AdcPerv5 |
| 0.6 | Fraction of pervious area covered by snow at interval ]0.6-0.7] | Yes | AdcPerv6 |
| 0.7 | Fraction of pervious area covered by snow at interval ]0.7-0.8] | Yes | AdcPerv7 |
| 0.8 | Fraction of pervious area covered by snow at interval ]0.8-0.9] | Yes | AdcPerv8 |
| 0.9 | Fraction of pervious area covered by snow at interval ]0.9-1.0] | Yes | AdcPerv9 |
Table: Edit fields in the Areal Depletion tab (mss_Temperature)
Adjustments
Climate Adjustments are optional modifications applied to the temperature, evaporation rate, rainfall intensity, and hydraulic conductivity that SWMM would otherwise use at each time step of a simulation. Separate sets of adjustments that vary periodically by month of the year can be assigned to these variables.
Adjustments to the hydraulic conductivity are used in computing rainfall infiltration on all pervious land surfaces, including those in all LID units, and exfiltration from all storage nodes and conduits.
These can reflect the increase of hydraulic conductivity with increasing temperature or the effect that seasonal changes in land surface conditions, such as frozen ground, can have on infiltration capacity.
They can be overridden for individual catchments (and their LID units) by assigning a monthly infiltration adjustment Time Pattern to a catchment. Monthly adjustment time patterns for depression storage and pervious surface roughness coefficient (Manning n) can also be specified for individual catchments (see chapter SWMM Hydrology and Hydraulic Properties).
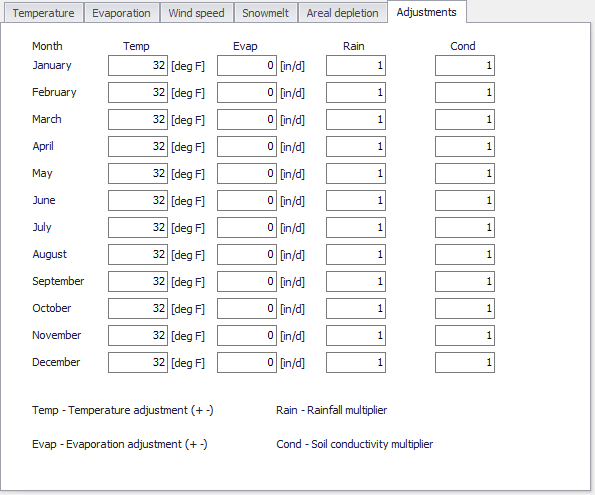
Figure: The SWMM Climatology Adjustments tab
| Edit field | Description | Used or required by simulations | Field name in datastructure |
|---|---|---|---|
| Temp | Temperature adjustment (+-) for the months January-Decembers | Yes | Temp01-Temp12 |
| Evap | Evaporation adjustment (+-) for the months January-Decembers | Yes | Evap01-Evap12 |
| Rain | Rainfall multiplier for the months January-Decembers | Yes | Rain01-Rain12 |
| Cond | Soild conductivity multiplier for the months January-Decembers | Yes | Con01-Con12 |
Table: Edit fields in the Adjustments tab (mss_Adjustment.Default_Adjustment)