Pump Q-H Plot
This type of plot is only relevant to Water Distribution models. It displays the operating pump points computed during the simulation period, on top of the pump curve defined in the 'Pumps' editor. QH results are obtained from the 'Pump flow' and 'Pump headloss per 1000unit' result values at each time step saved in the result file.
To display these Q-H results, click the 'Pump QH plot' button in the 'Results' tab of the ribbon, and select the result file to get pump results from (this result file must be loaded in the MIKE+ project beforehand).
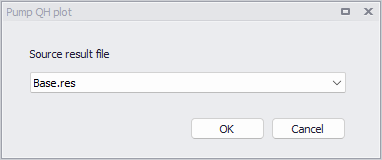
Figure: Selecting a result file to plot its pumps Q-H results
After selecting the result file, the 'Pumps' editor shows QH results from all corresponding pumps. Note that QH results from multiple result files may be superimposed by repeating the above step.
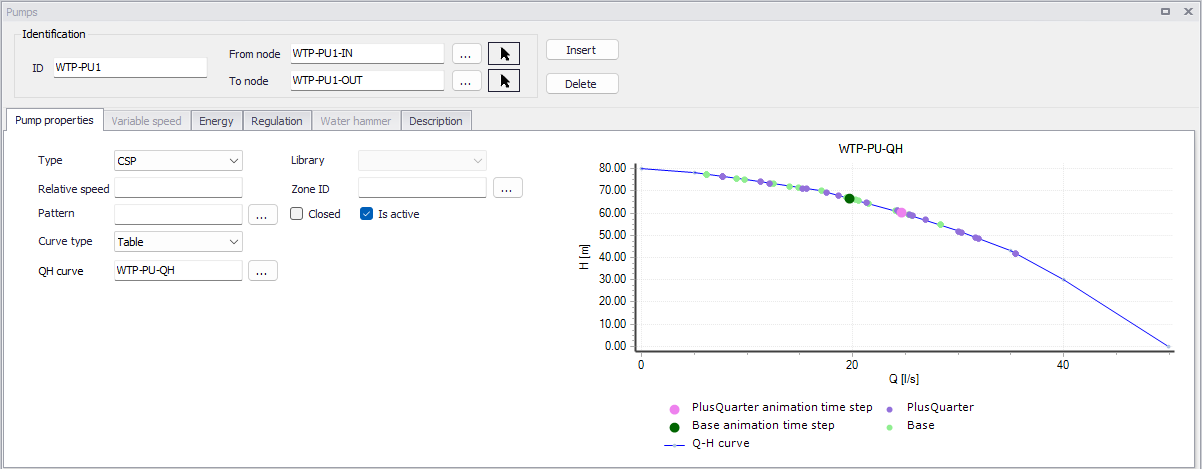
Figure: Displaying Q-H results from two simulations in the Pumps editor
For each result file added, two series are added to the plot: one showing the entire set of results (one QH point per time step in the result file), and one showing the current time steps as selected in the 'Results' tab of the ribbon.
The 'Properties' editor, available from the context menu of the plot, allows editing symbols for all series on the plot as well as removing results series.