Cross section Plots
A cross section plot displays animated water level results from network and/or 2D overland result files.
Cross section plots are created from the maps (main Map view or any result map), and result files must be loaded beforehand. For 2D overland results, both flexible mesh results (.dfsu files) and rectangular grid results (.dfs2 files) are supported. New cross section views are opened using the 'Cross section plot' button.
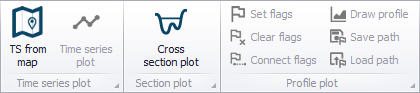
Figure: The Cross section plot tool in the Results ribbon
The 'Add cross section plot' window will show up, from where it is possible to select the files to plot the results from. When 2D overland files are available, a maximum spacing must also be specified, which controls the number of points to be plotted along the 2D cross section. Valid result files to be selected in this window are files containing a water level result item. If there is only one network result file available, this window will not show up, and the available result file will be used for the cross section plots.

Figure: The settings for the Cross section plots
The date and time of the water level being shown can be selected from the Results ribbon, or by clicking along the time axis of a Time series plot.
The topography information in the 2D domain is obtained from the 2D domain file, selected in the '2D domain' editor, when a model database is opened. If MIKE+ is used for results presentation only (no model database opened), the 2D domain file or DEM to be used as source of the 2D topography line must also be selected in the 'Add cross section plot' window.
Creating cross section plots from river results
To open a cross section view from a river network result file, click on a location on the Map view with a cross section.
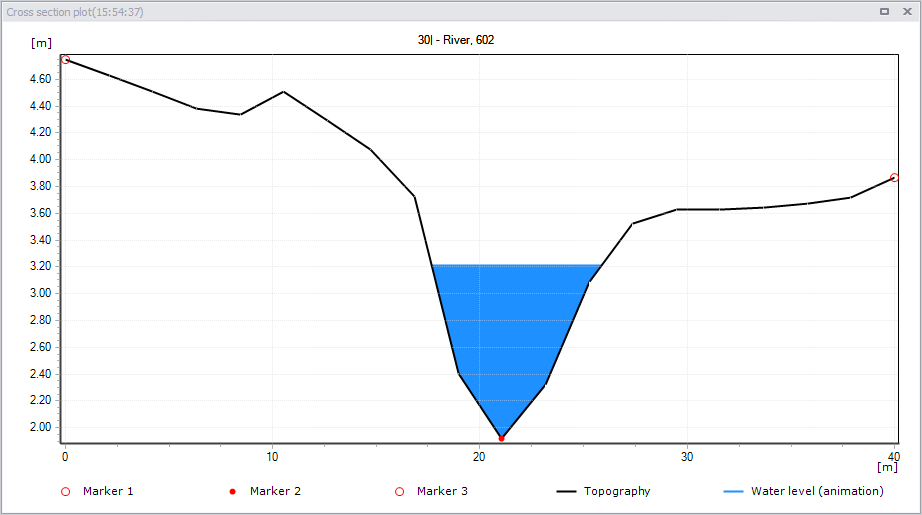
Figure: The Cross section plot window showing results from a river simulation
The topography line is obtained from the result file, and corresponds to the topography specified in the Cross sections editor. The water level is constant within this cross section, and is also obtained from the selected result point.
Creating cross section plots from 2D results
To open a cross section view from 2D overland result file, it is required to draw the horizontal location of the cross section on the Map view. To do so, hold the 'Control' key down and start digitizing a polyline on the map. It is possible to release the 'Control' key after clicking the first location.
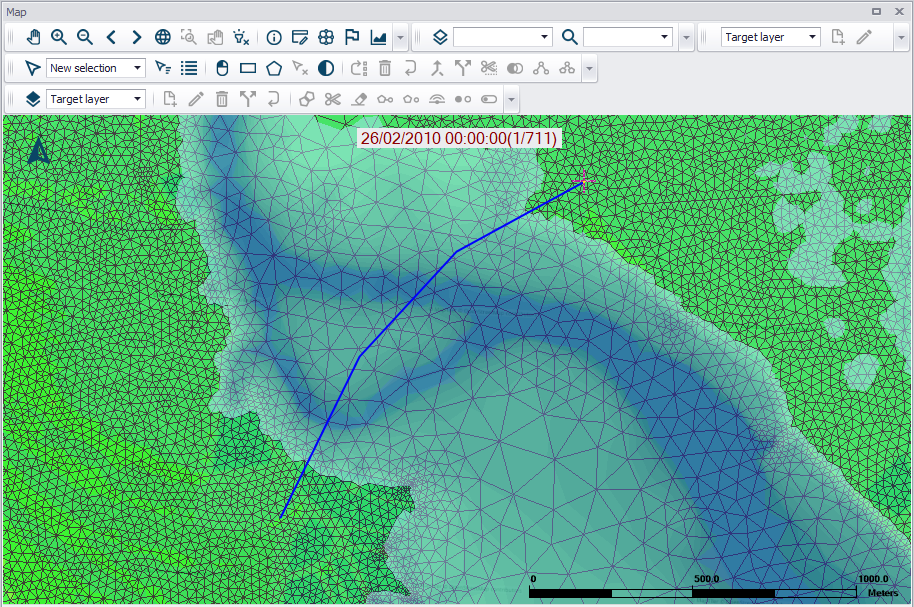
Figure: Digitising the location of a 2D overland cross section plot
The cross section plot shows a topography line with levels obtained from the 2D domain used in the 2D overland simulation, and a water level line obtained from the selected result file. Both lines are drawn with one point at each location clicked on the map, and adding intermediate points in-between with an equidistant interval controlled by the maximum spacing specified in the 'Add cross section plot' dialog.
For each point along the cross section, the plotted water level is the value of the 2D mesh element in which the point falls. For the topography line, the point's level is the average value from all the nodes defining the element.
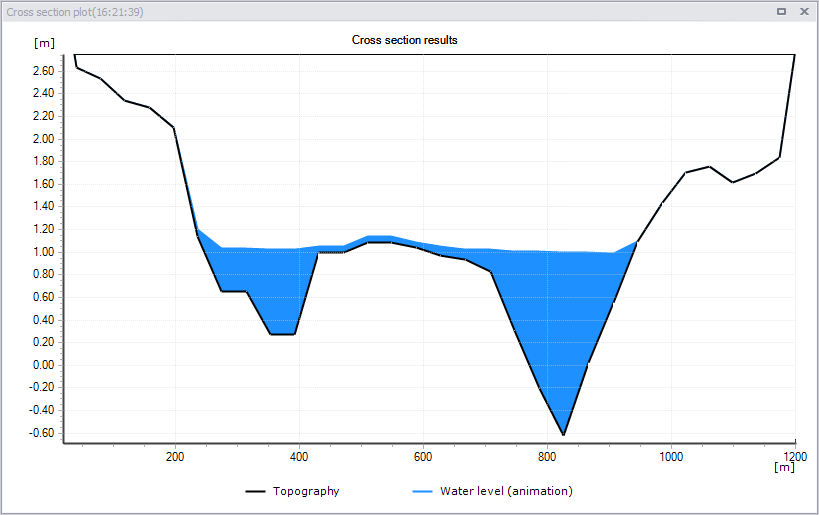
Figure: The Cross section plot window showing results from a 2D overland simulation
If there are gaps in the 2D domain (i.e. polygons excluded from the 2D domain), then the cross section plot will also show gaps at these locations.
Creating combined cross section plots
It is possible to combine river and 2D overland results in a common cross section view, in order to get an overview of the entire domain, regardless of the modelling technique. To open a cross section view with combined results, it is required to draw the horizontal location of the cross section on the Map view and to select (click) river cross sections during that process. To do so, hold the 'Control' key down and start digitizing a polyline on the map. It is possible to release the 'Control' key after clicking the first location.
During this digitisation process, it is possible to click river cross sections at any time, and the river cross section can therefore be added to the left, to the right or in the middle of the 2D cross section.
The resulting cross section plot shows the river cross section data first, and then 2D cross section data elsewhere. Therefore, in case the 2D results overlaps the extent of the river's cross section, the overlapping 2D data are not shown. On the contrary, there may be some gaps between the river cross section and the 2D cross section, in case there is a gap in the input 2D domain along the river. To reduce the risk of such gaps in the cross section plots, it is preferable to digitize the location perpendicular to the river.
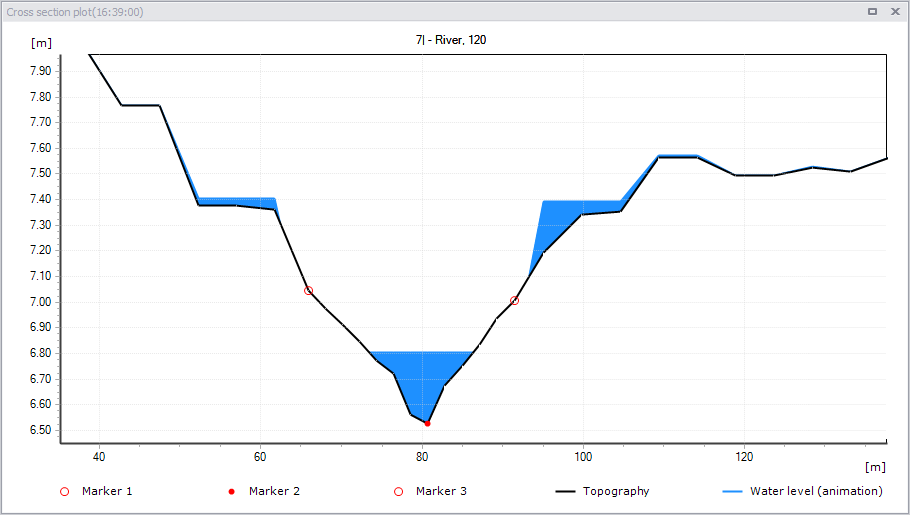
Figure: The Cross section plot window showing combined river and 2D overland results
The markers drawn on the cross section show the limits between the river and 2D overland data.
Plot Context Menu
Right-click on the profile plot to access the local context menu.
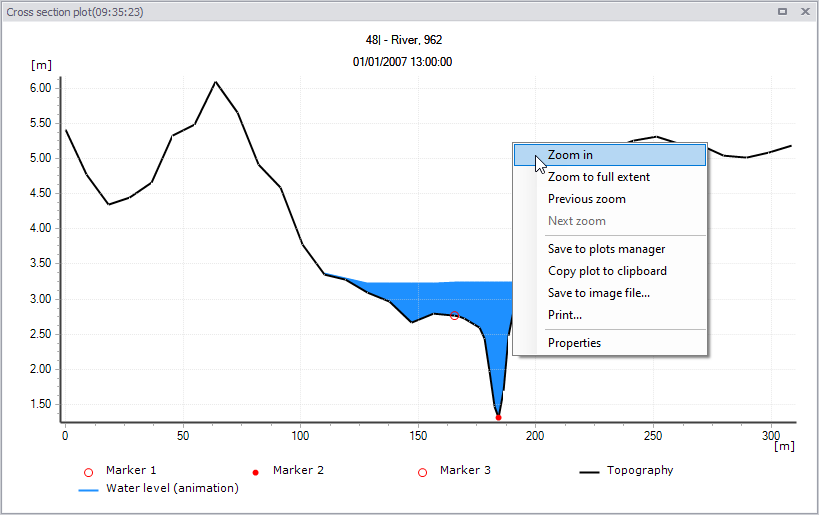
Figure: Right-click on the cross section plot to access the local context menu
Zoom to full extent, Zoom in, Next zoon, Previous zoom
Allows to zoom in and out on the plot. Zoom to full extent brings you back to the full view of visible cross section data on the plot. Panning is also enabled upon activation of zoom options, using the 'Shift' key.
Save to plots manager
Saves the cross section plot (location on the map and source result files) to the 'Plots' panel. The cross section plot will initially be added to the active folder from this panel. See Plots Management chapter for more information on options to save and manage results windows.
Copy to clipboard
Copies the cross section view displayed to the clipboard and allows it to be pasted into other applications.
Save to image file
Saves the cross section view displayed to an image file on the disk, using various supported image formats.
Print
Prints the cross section view displayed to the clipboard.
Properties
Activate this option to view the Cross section plot' properties dialog.
Cross section plot Properties
The properties of the cross section plot can be changed via the Properties dialog (figure below). The dialog is accessed from the 'Properties' option in the local context menu on the cross section plot area.
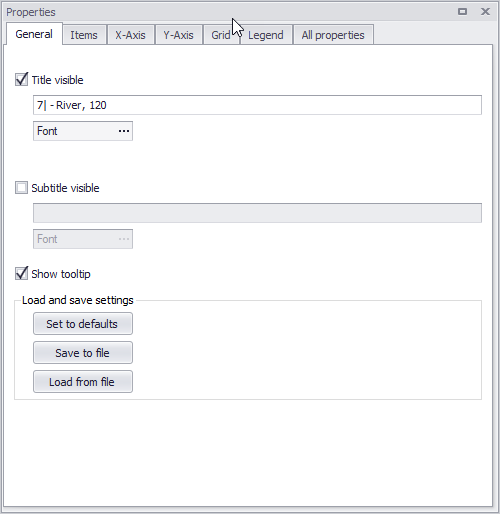
Figure: Setting the properties of the cross section plot
General
The dialog has various tab pages wherein changes to the cross section plot properties can be made.
The General tab page offers options for:
- Editing and formatting the plot title
- Adding and formatting a subtitle
- Showing the topography and water level results on the fly, in a tooltip
- Loading and saving these display settings to a file, to apply in other cross section plots
Items
On the Items page, it is possible to control which layers are drawn on the cross section plot. For each layer, it is also possible to customize its name shown in the legend, and change its symbology.
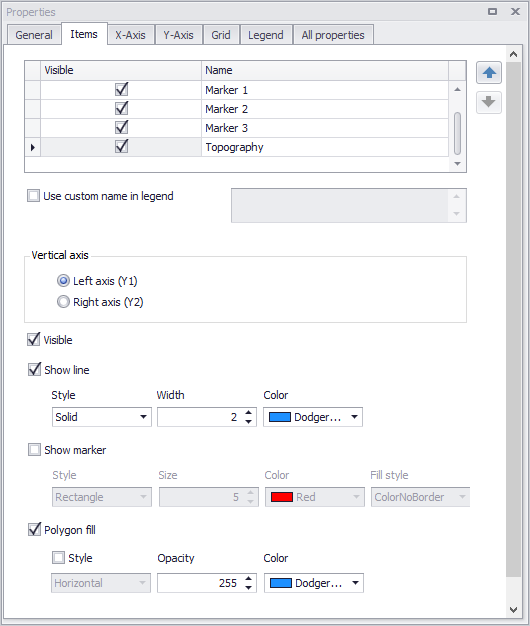
Figure: The Items tab
X-axis
The X-axis tab offers options for customizing axis title and label fonts, as well as modifying the vertical line appearance.
Y-axis
The Y-axis tab offers options for customizing axis title and label fonts, formatting labels as well as modifying the horizontal line appearance.
Grid
The Grid tab offers options for customizing the style for the horizontal and vertical lines appearance.
Legend
The Legend tab offers options for showing or hiding the legend, and also controlling its location within the cross section window.