Hydrant Q-H Plot
This type of plot is only relevant to Fire Flow analyses, when applying the method to compute a Q-H curve. In this case, the computed Q-H curve storing the relationship between the hydrant flow and the residual pressure is saved to a .csv file.
To display these Q-H data, the corresponding .csv files must first be loaded in the 'Results' tree view. New plots are created by right-clicking on the file, and selecting 'Show Q-H curve' in the context menu.
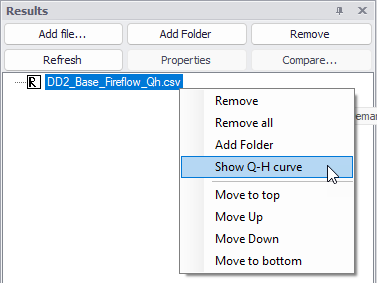
Figure: Creating a new Q-H plot
This opens a selection window, showing the list of .csv files with Q-H data and the list of junctions for which they contain a table. Select the list of junctions and files to plot, and then select between plotting data to a new window or to an existing one.
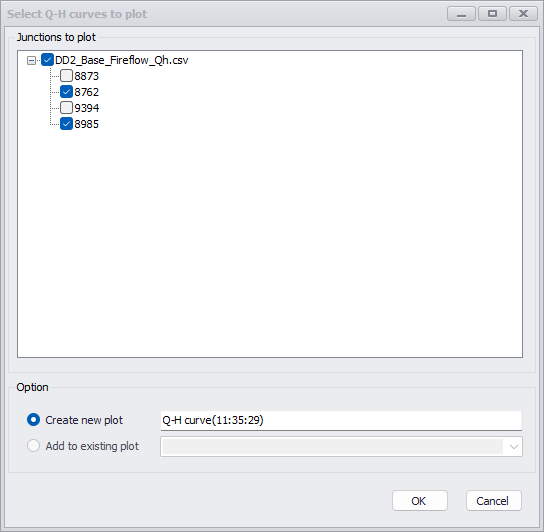
Figure: Selecting Q-H data to plot
Once opened, the Q-H plot window offers similar settings for controlling the layout as the Time Series Plot window.
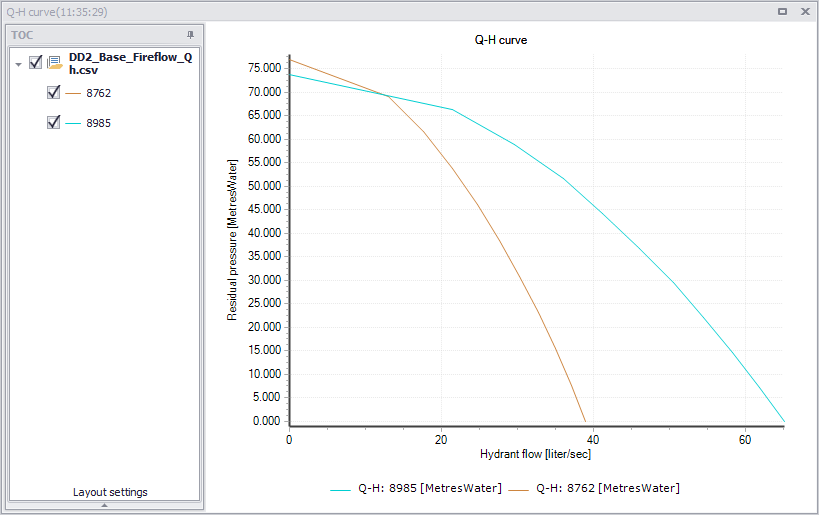
Figure: The Q-H plot window