LTS Outputs
A MIKE+ LTS simulation generates result files containing timeseries and various event-based and annual statistics.
LTS outputs are defined as any other model results, i.e. by specifying the wanted result files and their contents under result specification. The specified results are then included in the actual simulation setup, as required.
LTS outputs may take the following forms:
- "Standard" TS result outputs
- Extreme event statistics (instantaneous and accumulated)
- Chronological statistics (monthly and yearly)
- Continuous TS outputs
Standard TS result files
Standard TS result files with default or user-specified contents may be specified as part of an LTS simulations. These are actually "normal" result files, generated by the catchment and network models.
Common for all these files is that due to long simulation periods, they tend to be quite large and care should be taken to keep the size of such LTS outputs within reasonable limits.
The default MIKE 1D result files (*.res1d), where the computed time series for default result items are saved for entire model, may become extremely large in long-term simulations if the saving frequency is high. On the other hand, too coarse time resolution in a result file might make the saved results useless. Consequently, for simulations covering long periods, a user-specified result file with carefully defined contents will usually be of major interest.
The user-specified result file will only contain selected result items at locations of interest. This makes it especially practical for keeping LTS results sufficiently resolved and the default result file potentially unnecessary. Detailed information on the specification of the contents of user-specified result files is provided in the Result Specifications Chapter.
- Runoff result file
- Strictly speaking, runoff result files are not specific for LTS. A fundamental difference compared to runoff results in other types of analysis is the length of the simulation periods and, consequently, size of the file. In the context of LTS simulations, runoff result files may be used as input for job list generation and/or as boundary condition for LTS simulation. Due to highly dynamic character of surface runoff, the runoff result saving frequency must remain high during rainfall. During dry weather periods, the simulation time step and saving frequency is automatically changed to much longer "DWF" time step.
- RDI model is per definition continuous, so the results will be saved continuously for the entire simulation period.
- Inevitably, models many sub-catchments and long simulation periods will generate extremely large runoff result files (and, optionally, SWQ result files). If accompanied with surface pollution result files with multiple pollutants, this may become a serious problem. In order to avoid this, alternative workflow for the job list creation and LTS simulation are available (see the description of simulation workflows further ahead).
- Catchment discharge result file
- Similarly, as runoff result file, in context of LTS simulations, catchment discharge result files may be used as input for job list generation and/or as boundary condition for LTS simulation. Catchment discharge normally represent slowly chaining flows (diurnal wastewater and constant infiltration, where the simulation time step and result saving frequency can be low (e.g. 1 hour) without any significant loss of accuracy. However, catchment discharge is present continuously during the simulation period. This means that models with many sub-catchments and long simulation periods will generate extremely large catchment discharge result files (and, optionally, CD WQ result files). In order to avoid this, alternative workflow for the job list creation and LTS simulation are available (see the description of simulation workflows further ahead).
- Network result file
- When generated by LTS simulation, network result files contain time series the specified result items for the entire model domain or for the specified locations of interest. The time series are discontinuous, i.e. results are only available during the dynamic simulation. Due to normally high result saving frequency, these results may become very large unless the specified contents is user-specified, focused to really needed results.
Statistics Result File
When running any simulation over a longer period, information on operational statistics is of major interest rather than on the raw time series. MIKE 1D LTS can save additional result files (*.RES1D) containing various statistics (event- based and annual) over the individual computed time series and the system performance as a whole:
- LTS Event-based Extremes Statistics (instantaneous and accumulated)
- These result files contain ranked extreme values for the included result items and for the specified locations. The result items represent either extremes (peaks) of instantaneous variables (e.g. water level, discharge, concentration) and/or accumulated values of cumulative variables (e.g. volume, mass, duration) for the statistical events identified as described elsewhere in this document. Such results are typically desired for overflows, water levels, pumps operations, etc.
- LTS Chronological Statistics (monthly and yearly)
- These result files contain accumulated (monthly or yearly) cumulative variables for the specified locations in the system, sorted chronologically. Such results are typically desired for overflows and pollution emissions, pumps operations, etc.
The statistics are computed according to user specifications.
The technical background for statistical computations and the process of specifying which statistical results to save are further described in the following sections below.
Specification of Statistics and Result Files
LTS statistical results are stored in statistical result files (*.RES1D). As a bonus, an *.ERF file is also generated, which can be loaded in MIKE View for presentation and statistics report generation.
It is possible to combine LTS hydrodynamic simulations with pollution trans- port (AD) calculations. In this way, one can estimate statistics on annual or event-based pollutant loads.
The contents of the statistical result file (result items and locations) must be specified prior to an LTS simulation. Content statistics is defined through the Result Files dialog (Result Specifications| Result Files).
There are two types of LTS statistics results:
-
LTS Extreme Statistics. These are divided in two sub-types:
-
Instantaneous values statistics. Represent instantaneous extreme (peak) values. These include:
- Max water level. Saves ranked peak water levels.
- Max flow. Saves ranked peak flows.
- Max velocity. Saves ranked peak flow velocities.
- Max concentration. Saves ranked peak concentrations for all simulated pollutants.
-
Accumulated values statistics. Represent accumulated values during events.
- Event volume. Saves ranked event-accumulated discharge.
- Event mass. Saves ranked event-accumulated mass for all simulated pollutants
- Event duration. Saves ranked event duration.
-
LTS Chronological Statistics. These have the following two sub-types:
-
Individual chronological statistics. These may include accumulated dis- charge and pollutant mass transport in individual pipes, weirs, pumps, orifices, outlets, valves, and spilling nodes. Individual statistics imply multiple item values per file.
- Accumulated volume. Saves individual accumulated yearly/monthly discharge in chronological order.
- Accumulated mass transport. Save individual accumulated yearly/monthly mass flux for all simulated pollutants in chronological order.
- Global accumulated statistics of discharges and emissions. These include accumulated discharge and pollutant mass transport for ALL out- lets and weirs, pumps, orifices, valves discharging out of the system, and all spilling nodes, as well as TOTAL accumulated discharge and pollutant mass transport out of the system. Global statistics imply one (i.e. TOTAL) item value per file.
- Total accumulated volume. Saves chronological total accumulated yearly/monthly discharge.
- Total emission. Saves chronological total accumulated yearly/monthly mass flux for all simulated pollutants.
LTS statistics result items are specified in the LTS HD Items and LTS AD Items tabs in the Result Files editor. Available statistics results items are presented in the four following figures.
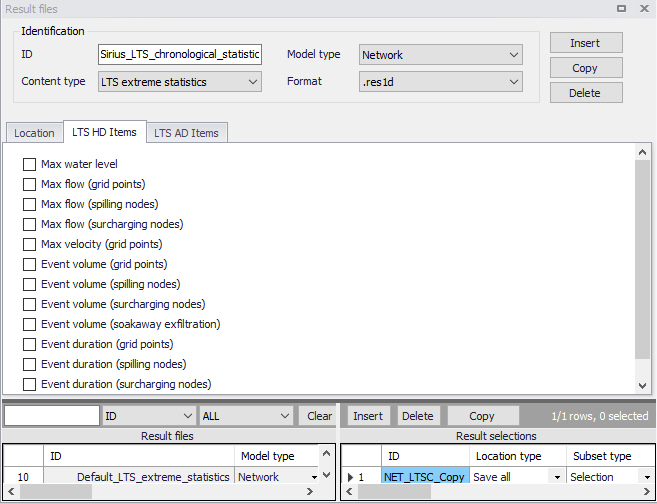
Figure: LTS HD Items for event-based extreme statistics in the Result Files editor
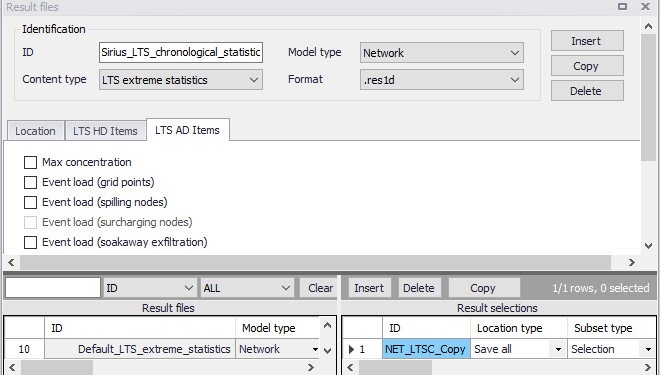
Figure: LTS AD Items for event-based extreme statistics in the Result Files editor
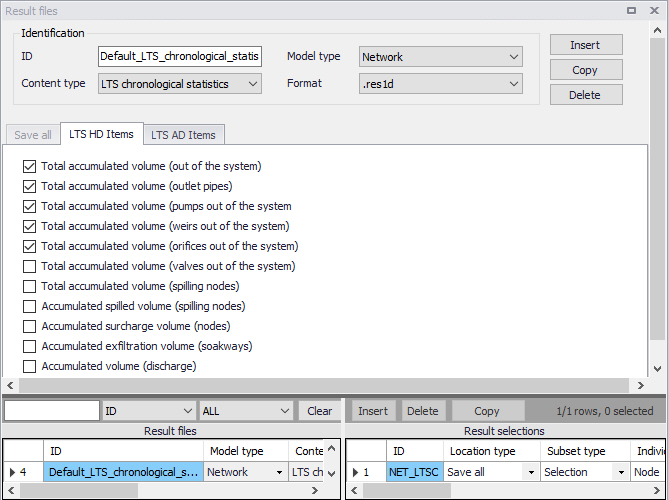
Figure: LTS HD Items for annual/monthly statistics in the Result Files editor
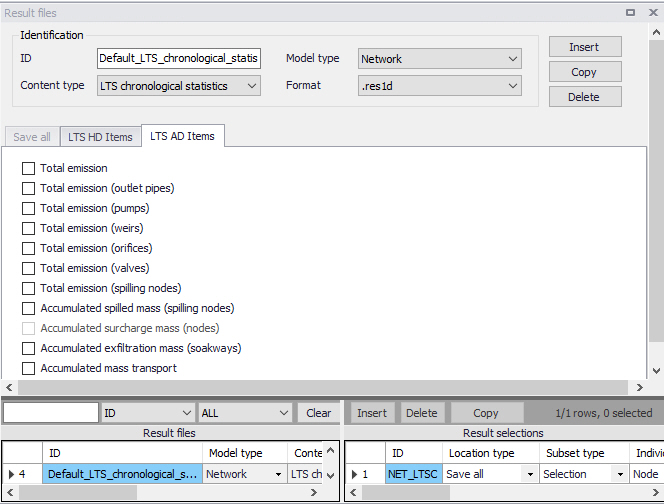
Figure: LTS AD Items for annual/monthly statistics in the Result Files editor
Applicability of LTS statistics to various types of model elements
LTS statistics output is defined by the result item type and by location. Availability of certain statistics at a specific location depends on the compatibility of the location and item type, and on the actual implementation status. A complete overview of the currently available statistics is provided in the three tables below.
| Result Type | Node (Manhole, Basin) | Spilling nodes (Cover Type = Spilling) | Surcharged nodes (WL > GL) | Soakaways |
|---|---|---|---|---|
| Max water level | Yes | Yes | Yes | Yes |
| Max flow | Yes | Yes | Yes | |
| Event volume | Yes | Yes | Yes | |
| Event duration | Yes | Yes | Yes | |
| Max concentration | Yes | Yes | Yes | |
| Event load | Yes | Yes | ||
| Total accumulated volume | Yes | |||
| Accumulated volume | Yes | |||
| Total emission | Yes | |||
| Accumulated mass | Yes |
Table: Statistics result types in nodes (Manholes, Basins and Soakaways)
| Result Type | Link (Grid point) | Outlet (Outlet pipe) |
|---|---|---|
| Max water level | Yes | Yes |
| Max flow | Yes | Yes |
| Max velocity | Yes | |
| Event volume | Yes | Yes |
| Event duration | Yes | Yes |
| Max concentration | Yes | Yes |
| Event load | Yes | Yes |
| Total accumulated volume | Yes | |
| Accumulated volume | Yes | |
| Total emission | Yes | |
| Accumulated mass | Yes |
Table: Statistics result types in links (Links and Outlet pipes)
| Result Type | Pump | Weir | Orifice | Valve |
|---|---|---|---|---|
| Max flow | Yes | Yes | Yes | Yes |
| Event volume | Yes | Yes | Yes | Yes |
| Event duration | Yes | Yes | Yes | Yes |
| Max concentration | Yes | Yes | Yes | Yes |
| Event load | Yes | Yes | Yes | Yes |
| Total accumulated volume | Yes | Yes | Yes | Yes |
| Accumulated volume | Yes | Yes | Yes | Yes |
| Total emission | Yes | Yes | Yes | Yes |
| Accumulated mass | Yes | Yes | Yes | Yes |
Table: Statistics results in outflow structures (Pumps, Weirs, Orifices, and Valves leading out of the system)
Specifying location for LTS statistics results
LTS statistics outputs are per definition user-specified. For such (non-Default) results it must be specified for which location(s) the desired results are to be saved.
As for "normal" result files, the location type for LTS statistics can be either 'Save all' (the whole system), 'Save subset' (Selection), 'Save individual' (Location ID), or 'Save within polygon'.
If 'Save subset' or 'Save individual' is selected, supplementary information on the selection list or element ID should be specified.
Additionally, for LTS statistics some pre-defined groups can be specified as subsets, such as:
- Pipes and canals
- Manholes
- Pumps
- Weirs
- Orifices
- Valves
- Outlet nodes
- Basins
- Soakaways
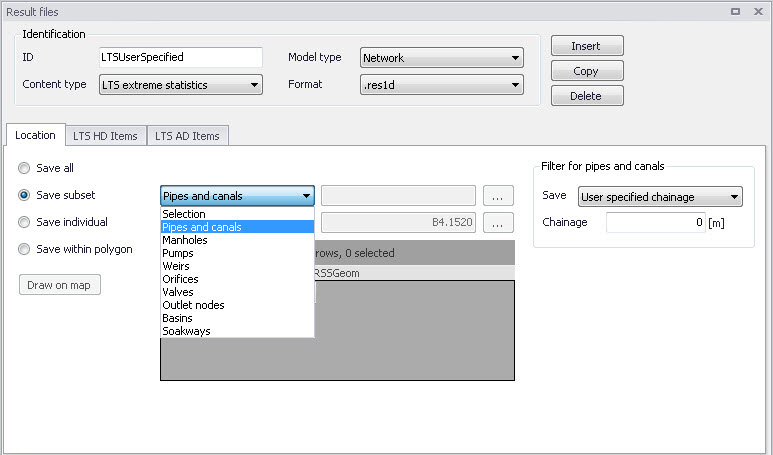
Figure: Pre-defined result location subset groups
For pipes and canals, the location for saving results can be specified as:
- All grid points
- Upstream grid point
- Downstream grid point
- Both upstream and downstream grid points
- Middle grid point
- User-specified chainage. Specify the chainage in the Chainage input box.
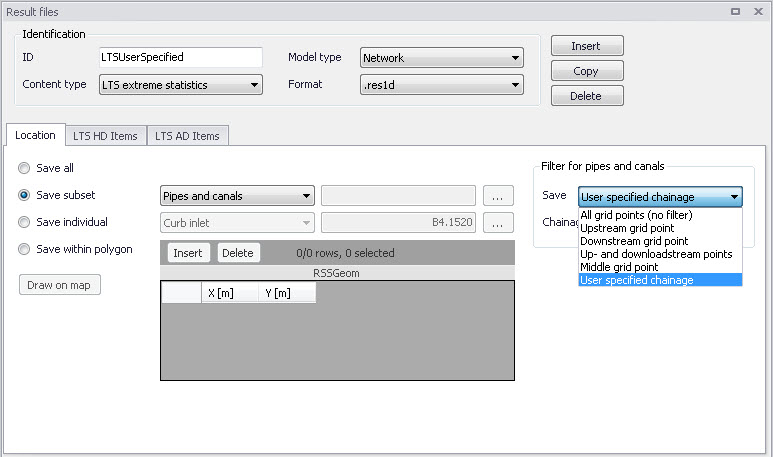
Figure: Grid point selector for result locations in pipes and canals
For chronological (annual/yearly) LTS statistics, the result items themselves define a subset of the model. E.g. result items "Total accumulated volume (weirs out of system)" contains statistics for accumulated volume of all weirs discharging out of the system. This filtering works jointly with the initially specified location, so that separate results of the same type can be achieved for various parts of the system. E.g. if definition of "Location" only includes weirs discharging into one of several recipients in the model area, the "Total accumulated volume (weirs out of system)" will be calculated and summed up for these weirs only.
If the same LTS statistics result type is used more than once (e.g. that the results from the above example are created for all local recipients separately and for the entire system), these need to be saved in separate result files.
Continuous LTS TS Outputs
Per definition, LTS network simulations generate discontinuous time series, with results available during dynamic simulation only. In the time intervals between events that are simulated dynamically, the variables values are set to zero.
At some locations in a modelled system it is advantageous to study a complete time series, also including the intervals between the dynamically simulated events. A typical example is the inflow to a WWTP.
MIKE+ LTS allows for the specification of any number of locations (links) in the system where such continuous discharge time series is generated by the system.
A continuous time series in the specified link is constructed by concatenation of the network simulation results during events and the sum of all hydraulic loads (boundaries) contributing to the flow in the specified link during inter-event periods. Obviously, the flows inserted in the inter-event periods are not hydraulically correct, but only an approximation. Volumes of the inserted flows are correct, but the peak amplitudes and timings inherently include an error, as the transport time and hydraulic diffusion in the network are not accounted for.
The contributing loads are user-defined by specifying the "Location" - a set of nodes and links located upstream the specified link. All loads (boundary conditions defined as runoff input, catchment discharge, load point, lateral inflows, infiltration) associated with the included model elements will be included automatically.
Accurate definition of the model elements contributing to the flows in the specified link is solely the modeler's responsibility - the model does not check if the listed elements really contribute to the specified link discharge.
The continuous time series are saved in a network result files with the contents type "LTS continuous". As for any other LTS result file, there is no default configuration available. This means that when a continuous TS output is wanted, LTS result file with continuous output TS must be created and configured "from scratch", and finally included in the actual LTS simulation setup.
The following parameters define LTS continuous result file:
| File name: | user-specified |
|---|---|
| File name: | user-specified |
| Model Type | Network |
| Content type: | LTS continuous |
| Format | res1d or dfs0 |
| Location (contributing to the system): | Save all Save selection Save within polygon |
| Location (LTS continuous output in pipe of canal): | Any link |
| HD items | Discharge |
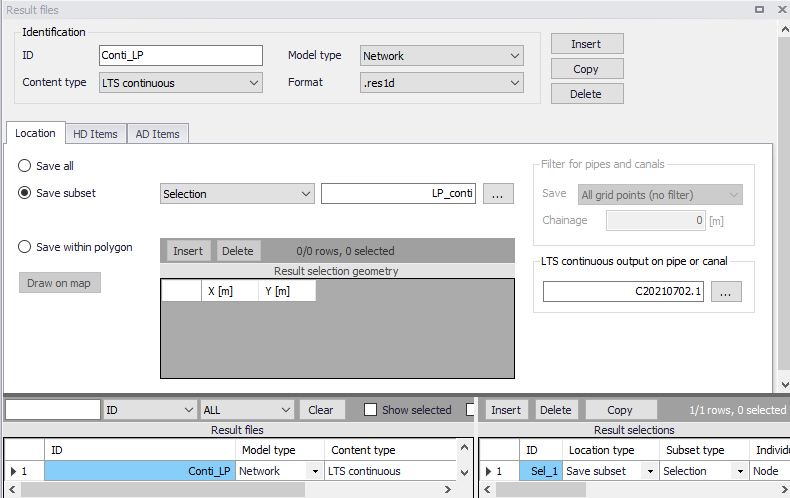
Figure: Continuous LTS TS output definition
The continuous LTS TS outputs are saved with two different frequencies:
- During dynamic simulation: user-specified save frequency in "Simulation setup | Results (Default: 60 seconds)
- Inter-event intervals: user-specified save frequency in "LTS Global parameters | Continuous DWF TS save frequency" (Default = 1 hour)