Curves and Relations
Data curves are defined in the Curves and Relations editor. The following curves can be used to represent relationships:
- Pump Efficiency: Efficiency versus flow for pumps
- Valve Head Loss: Head Loss versus flow for GPV General Purpose Valve.
- Pump Q-H Curve: Head versus flow for pumps.
- Tank Depth-Volume Curve: Volume versus depth for tanks.
- Water Source Price: Production water costs versus produced volume.
- Transient Q-Boundary: Inflow/outflow at the boundary node versus time (only for Water Hammer Analysis).
- Transient H-Boundary: Hydraulic Grade Line at the boundary node versus time (only for Water Hammer Analysis).
- Valve Operation Schedule: Valve opening versus time (only for Water Hammer Analysis).
- Valve Characteristics Cd: Valve flow coefficient Cd versus valve opening
- Valve Characteristics Kv: Valve flow coefficient Kv versus valve opening
- Dual-acting characteristics: Volume of air versus pressure difference (only for Water Hammer Analysis)
- Pump Operational Schedule: Pump speed versus time (only for Water Hammer Analysis).
- Pump Torque: Pump torque versus flow (only for Water Hammer Analysis).
- Motor Torque: Motor torque versus pump speed (only for Water Hammer Analysis).
- PID Set Point Value Curve: Set point setting versus fraction of a day (only for RTC Real-time Control Analysis).
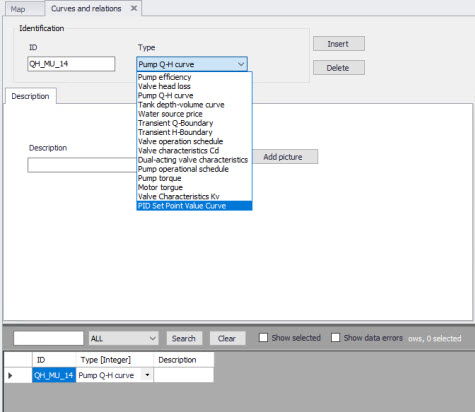
Figure: Curve and relations, Identification
Any number of curves can be created. The values to be included in each specific curve can be edited in the grid editor, where entries can be added, deleted, reordered and sorted.
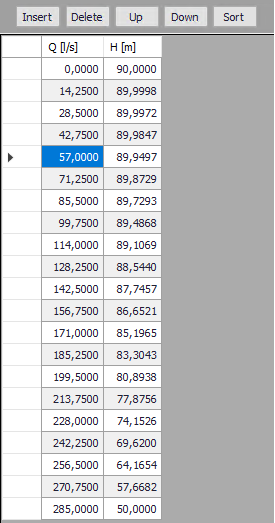
Figure: Curves and relations, definition of curves data
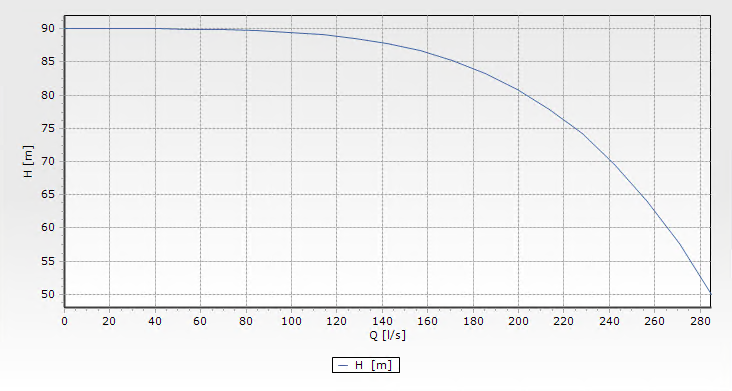
Figure: Preview of a defined curve in the Curves and relations editor
The points of a curve must be entered in order of increasing X-values (lowest to highest).
Data rows in any of the curve’s definitions must not have 2 or more lines with the same X-value.