Results Menu
With MIKE+ you can present results in several ways. This includes map plots, time series plots, animations, profile plots, and more.
Chapter Results Presentation provides details on results presentation in MIKE+.

Map Operations

Add file
Option for adding/loading result files into the project.

File manager
Activates the Results View panel, wherein various result files loaded in the project are managed.

Refresh
Refreshes values for overwritten/modified result files.

Create result map
Launches the Result Items dialog, from where simulation results may be presented in result map plot.

Add result item
Option for adding a result item to an existing result map plot.
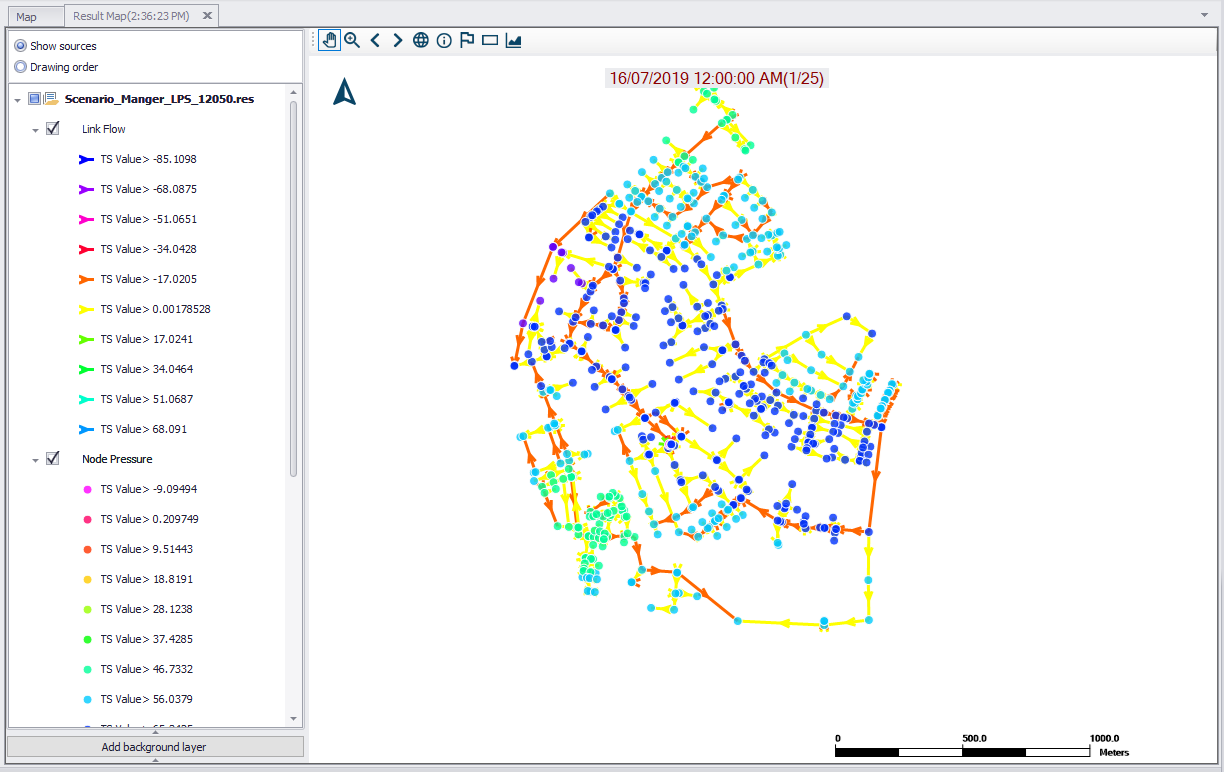
Figure: Example result map plot
Time Series Plot
Offers tools for creating time series plots of result file items. Also see Chapter Time Series Plot.

TS from map
Option for quickly creating a time series plot of simulation results by selecting features from the main Map.

Time series plot
Launches the Result Items dialog, from where simulation results may be presented in a time series plot. A tabular view of time series values is also available from the resulting TS Plot window.
Profile Plot
The Profile Plot toolbox on the Results menu ribbon contains tools and functionalities for creating longitudinal profile plots from result maps. I.e. they work for result map items, and not main Map items.

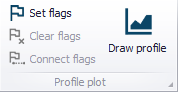
Set Flags
Tool for placing flags at nodes along a profile on a result map.
Clear Flags
Remove set flags on a result map.
Connect Flags
Identifies and highlights the path between set flags on the result map.

Draw Profile
Creates a longitudinal profile plot in a new widow. Use the 'Add result item' tool on the window to add result items to the profile plot as needed. Chapter Profile Plots provides more details on the Profile Plot toolbox.
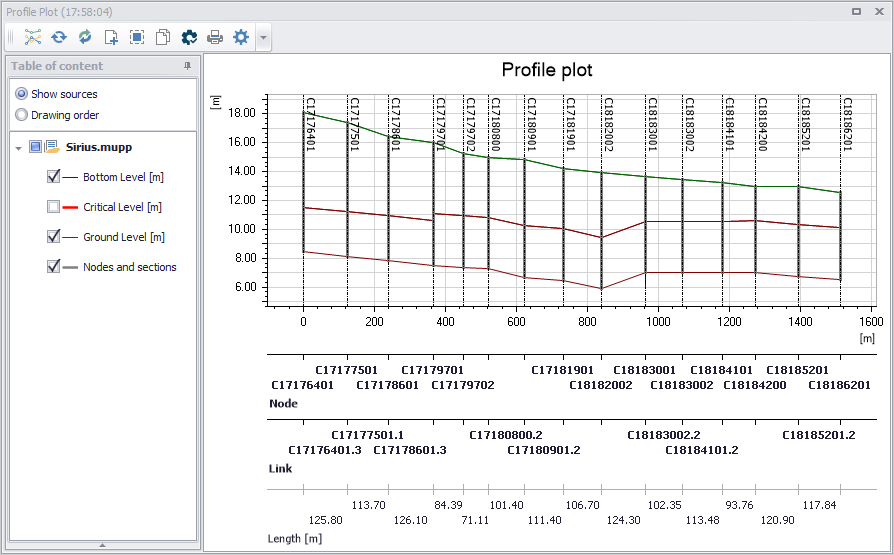
Figure: MIKE+ profile plot example
Save path
Saves the list and location of the current flags to a file (*.path).
Load path
Re-uses flags previously saved to a *.path file.
Animation
This toolbox offers functionalities for animating dynamic simulation results on the result map plot. Various tools allow control of the animation.
See Chapter Animations for more details.
Table

The Results Table tool launches the Result Items dialog, from where simulation results may be presented in a table. The results table provides an overview of all or selected results in tabular form. Various information is available depending on the type of result file selected.
See Chapter Results Table for more details on result tables.
Reporting

The Model Result and Report tool offers facilities for setting up reports based on information from model data as well as simulation results.
See Chapter Reports for details on creating Reports in MIKE+.
Calibration

Calibration is primarily focused on reproducing the observed hydraulics and water quality behaviour of the system in terms of flow depth/pressure, flow discharges and velocities. It involves comparisons between model simulation results and field measurements.
The Calibration Plots functionality offers options for setting-up comparison plots between simulated and observed data at various points in the model.
See Chapter Calibration Plots for details on Calibration in MIKE+.
Alarms (For WD models)

The Alarms and Violations tool provides a way to impose user-defined checks for Water Distribution model results. It allows for quick examination of the performance of elements that are important to the WD system, or of particular interest to the user.
See Chapter "Alarms and Violations" for details on the tool.