Shutdown Planning
Shutdown planning is designed to determine impact of pipe maintenance on the water supply conditions. It helps the user to define the shutdown, find isolation valves, run hydraulic simulations, and evaluate simulation results. Shutdown planning includes these steps:
- Planning shutdown
- Close pipes for selected isolation valves
- Analyse shutdown
- Generate shutdown results
- Generate shutdown report.
The 'Shutdown Planning' editor is available after activating the ‘Shutdown Planning’ analysis in the ‘Model type’ editor.
The 'Shutdown planning' editor
A list of the Shutdown Planning attributes follows, with a short description given for each one.
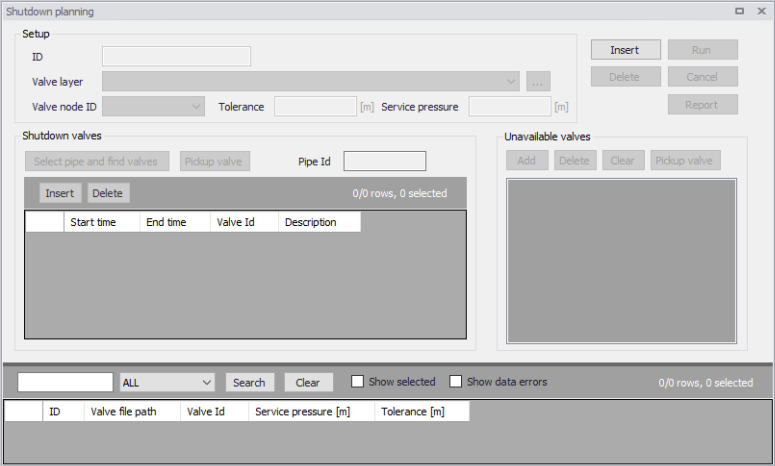
Figure: The Shutdown Planning editor
Setup
The 'Setup' group contains the following attributes:
- ID: This data entry allows you to identify the shutdown analysis. You can define multiple shutdown planning analyses and they will be displayed in the main grid at the bottom of the Shutdown Planning dialog box.
- Valve layer: This data entry allows you to select the GIS layer with valves (typically isolation valves) that will be used in the valve criticality analysis. Please note, that in order to select valve layer in this data entry, the valve layer needs to be already added to the Map layers
- Valve node ID: This data entry allows you to define the ID field used for reporting GIS valves
- Tolerance: This data entry allows you to define the spatial tolerance that will be used to track the pipe network connectivity
- Service pressure.
Shutdown valves
The 'Shutdown valves' group contains the following attributes:
- Select pipe and find valves: This command allows you to define the pipe that you want to isolate by clicking the pipe in the Map. Once the pipe is selected, the program will find valves that need to be closed in order to isolate the selected pipe. The list of valves is displayed in the grid and the pipe ID is displayed in the Pipe ID field.
- Pickup valve: Pickup valve allows you to select a valve (manually) from the Map. Once selected, the valve will be added into the table with valves
- Pipe ID: ID of a pipe that is selected for the shutdown analysis
- Insert: Insert a new line (record) into the table with valves
- Delete: Delete a line (record) from the table with valves
- Start time: Start time is the time when the selected valve will be closed during the shutdown planning
- End time: End time is the time when the selected valve will be re-opened during the shutdown planning.
Unavailable valves
The 'Unavailable valves' group contains the following attributes:
- Add: In case that one of the valves that were identified by the program as required in order to isolate a pipe is unavailable (e.g. malfunctioning or not physically available), this command allows you to define such a valve or valves and the program will find substitute valve when you click “Pickup valves”
- Delete: Delete a line (record) from the table with unavailable valves
- Clear: Delete all lines (records) from the table with unavailable valves
- Pickup valves: This command allows the program will find substitute valves for valves that are selected as “unavailable”.
Main buttons
- Insert: Create (insert) a new shutdown planning analysis
- Delete: Delete active shutdown planning analysis
- Run: Run the hydraulic simulation to analyse the pressure and flow conditions during the shutdown planning analysis
- Report: Generate a report from the shutdown planning analysis.
Running simulations
Click the 'Run' button from within the 'Shutdown planning' editor in order to run the simulation. The simulation progress will be displayed in the application status window. The simulation can be interrupted (cancelled) by pressing the Esc key.
Shutdown planning results
Results of the shutdown planning analysis simulations can be displayed as results for the standard hydraulic simulations.
From a Shutdown planning analysis result layer on the map, symbology settings may be used to highlight the shutdown area - e.g. pipes with zero flow displayed in red. The same may be done for nodes where the pressure is below the service pressure.
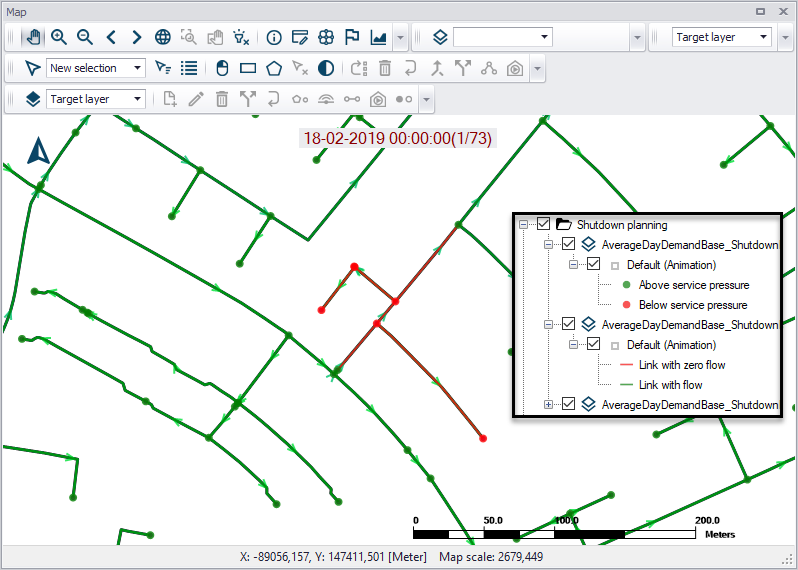
Figure: Example map of Shutdown Planning results highlighting pipes with zero flow in the shutdown scenario (in red)
In addition to the map display, it is possible to get a report for shutdown planning using the 'Report' button in the 'Shutdown planning' editor. It can generate a report on the valves that closed, pipes with zero flow and the list of demand allocation that have insufficient pressure.
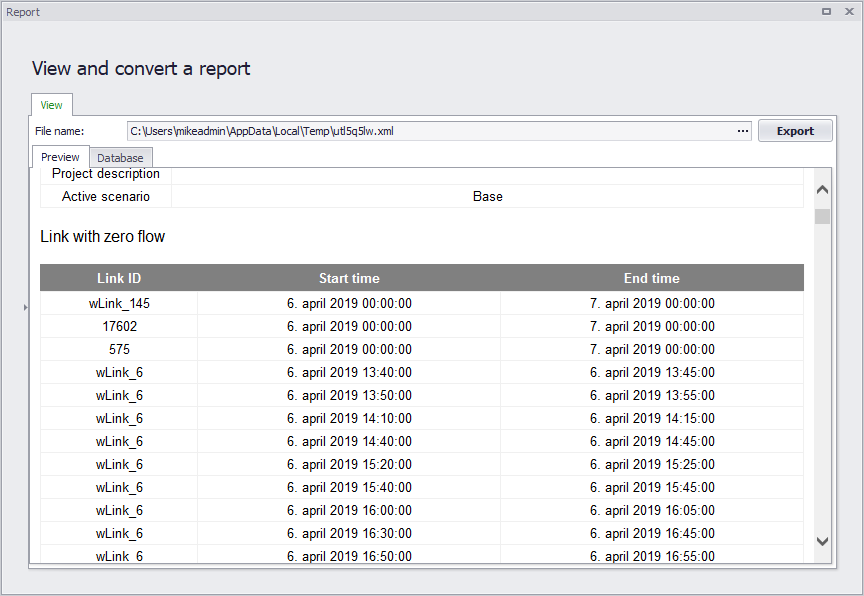
Figure: Example Shutdown Analysis report