Cost Analysis
The Cost analysis allows to review energy consumption results on more details, create tabular outputs, and great graphs of pump/turbine utilization, average power consumption/production, and energy costs.
The 'Cost analysis' editor
In the 'Simulation' group, the ID of the associated simulation (from the 'Simulation setup' editor) which is used as the base of the cost analysis, must be selected. Then the following parameters must be specified in the 'Settings' tab:
- Currency: The currency name. It can be selected from the list of available currencies. If not available from that list, select 'Other' to enter a custom currency name
- Global Price: Average cost per kW/hour for the pump / turbine
- Price Pattern ID: ID label of time pattern describing how energy price varies with time for the pump / turbine
- Pump/Turbine Efficiency: The single perfect efficiency of the pump/turbine
- Demand Charge: Added cost per maximum kW usage during the simulation period for the pump
- Carbon emission factor: this optional entry is used for computing carbon emissions related to pump energy in mass of CO2 per kWh. Hence the user can define the amount of carbon emissions per unit of energy usage.
The engine combines the hydraulic results of pumps/turbines and their general parameters to calculate the energy cost of each pump and turbine, as well as the statistical data.
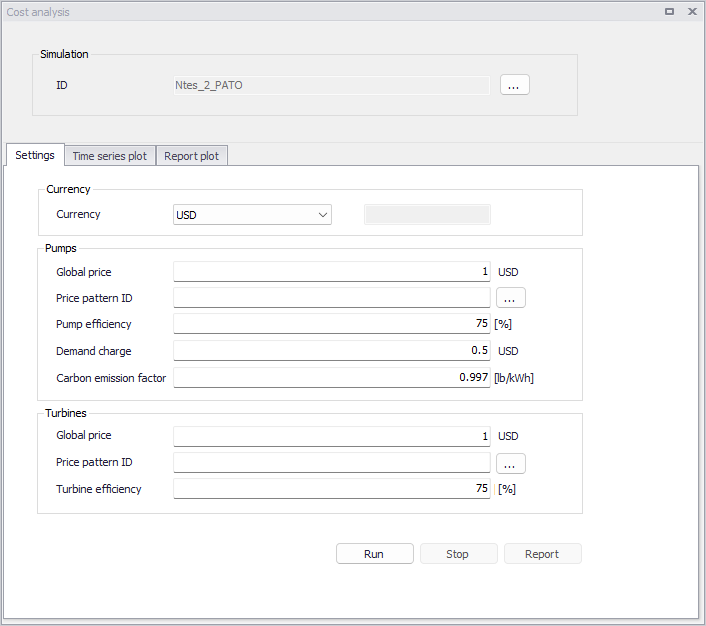
Figure: The Cost Analysis editor
Time series plot
The 'Time series plot' tab displays the time series of energy consumption or generated, energy cost, efficiency and average energy per million cubic meters (or gallons) of each pump and turbine. The result data table is also accessible on the right side of the panel.
- Efficiency: efficiency of pump/ turbine with time (%)
- Energy per volume: Accumulated power consumption/production (kWh) per millions gallons (or cubic meters)
- Power used: Energy consumption during a pump operation over time
- Power generated: Energy production during a turbine operation over time (negative to represent generated energy)
- Energy Cost: The accumulated cost of energy consumption or generated of the pump/turbine operation over time (negative to represent generated energy).
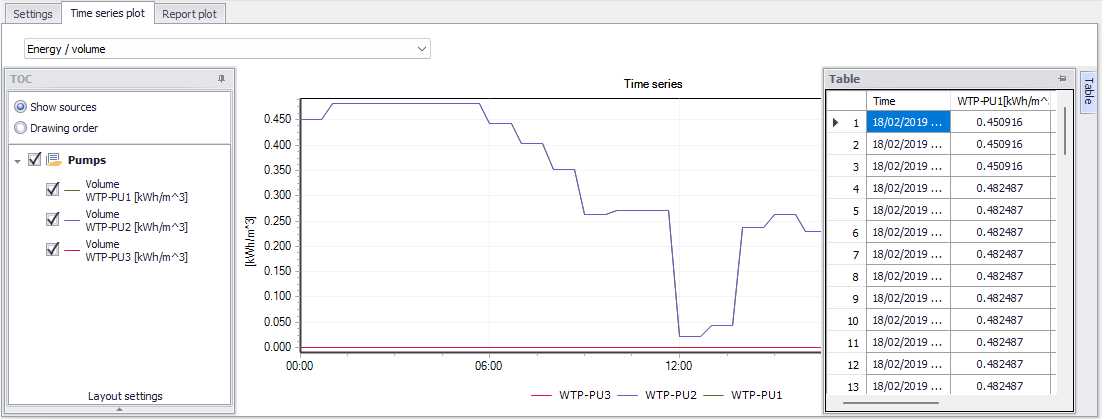
Figure: Cost Analysis Time series plot
Report plot
The 'Report plot' tab displays the statistical data of pump / turbine utilization, average efficiency, energy / volume, average power consumption, peak power consumption, and cost per day.
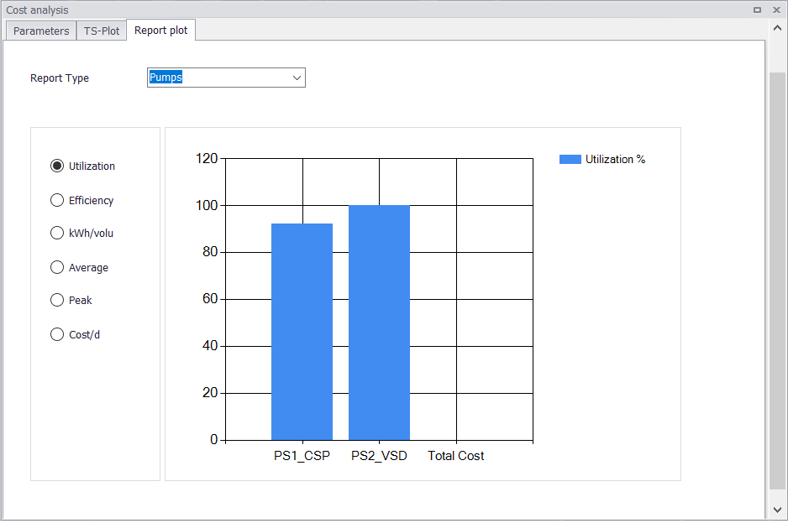
Figure: Cost Analysis Report plot
The following fields are calculated and reported:
- Utilization: percent utilization i.e. percent of the time that the pump / turbine was operating
- Efficiency: Average efficiency of the pump / turbine
- Energy per volume: Energy consumption pumped or turbine production
- Average power: Average rate of energy usage if the pump or turbine power generated
- Peak power: Peak rate of energy usage of the pump operation
- Cost/day: total cost of the pump / turbine operation per day.
Report
This type of report presents all the statistical energy data of all pumps and turbines, including system energy performance indicators.
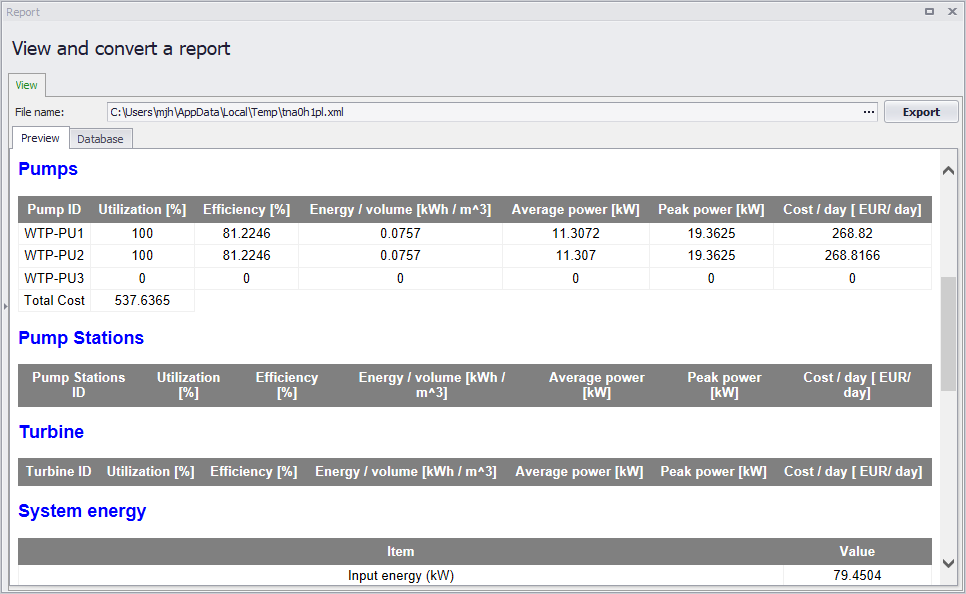
Figure: The Energy Report
The report has the following sections:
- Model description
- Pumps
- Pump stations
- Turbines
- System energy
- Sum.
Model description
This section contains information about the model file, project title and descriptions and name of the active scenario.
Pumps
This section contains the following outputs for each pump:
- Utilization: average pump utilization (%)
- Efficiency: average pump efficiency (%)
- Energy/volume: energy per volume (kWh/volume)
- Average power: average pump power (kW)
- Peak power: pump peak power (kW)
- Cost/day: average costs per day (currency).
Pump stations
If pump stations have been defined in the network model, the same outputs as for individual pumps will be reported at the station level.
Turbines
This section contains the following outputs for each turbine:
- Utilization: average turbine utilization (%)
- Efficiency: average turbine efficiency (%)
- Energy/volume: energy per volume (kWh/volume)
- Average power: average turbine power (kW)
- Peak power: turbine peak power (kW)
- Cost/day: average costs per day (currency).
System energy
This section contains the following performance indicators for the whole system (model):
- Input energy: total input energy (natural and pumps) (kW)
- Natural input energy: external energy supplied by reservoirs or external tanks (kW)
- Pump shaft input energy: flow rate pumped by station and the head of pumps (kW)
- Energy delivered to users: based on supplied pressure and flow (kW)
- Friction energy on pipes: energy lost due to friction in pipes (kW)
- Friction energy on valves: energy dissipated on valves (kW)
- Output energy: total output energy (delivered to users). Energy lost due to water losses is not accounted for (kW).
- Dissipated energy: total dissipated energy (kW)
- Pump motor input energy: pump motor input energy (kW)
- Shaft energy per injected volume: pump energy per injected volume (kWh/volume)
- Shaft energy per consumed volume: pump energy per consumed volume (kWh/volume)
- Excess of supplied energy: the ratio between the real energy entering the system and the minimum useful energy (based on minimum required service pressure of 35m or 50 psi) (-)
- Network energy efficiency: ratio between energy injected vs delivered to users (consumed) (-)
- Standard compliance: the ratio between the energy delivered to users and the minimum required useful energy (based on minimum required service pressure of 35m or 50 psi) (-)
- Carbon emission: the total mass of CO2 emitted for pumps
- Carbon emission per day: the average mass of CO2 emitted for pumps per day.
Sum
This section contains the following information:
- Energy: total pump or turbine energy (kwh)
- Energy cost: total pump or turbine energy costs (currency)
- Daily energy cost: average daily energy costs (currency)
- Volume: accumulated pump or turbine volume (volume unit)
- Unit energy use: unit energy use (kwh/volume)
- Unit energy cost: unit energy costs (cost/volume)
- Peak demand cost: peak demand costs for pumps (currency)
- Run duration: pump or turbine (motor) hours (hours).