Bar Chart
Simulation results may be plotted as bar charts in MIKE+. These types of plots are especially relevant for visualizing LTS simulation results.
To create a new bar chart, right-click on the result file or one of its result items in the list of result files.
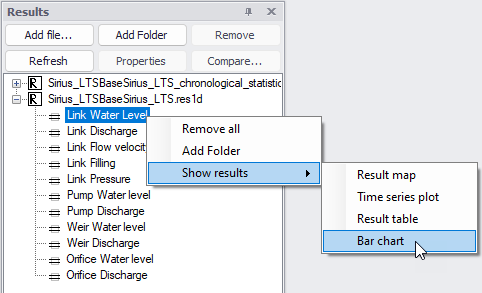
Figure: Creating a bar chart from the list of result files
This will open the 'Create bar chart' window below.
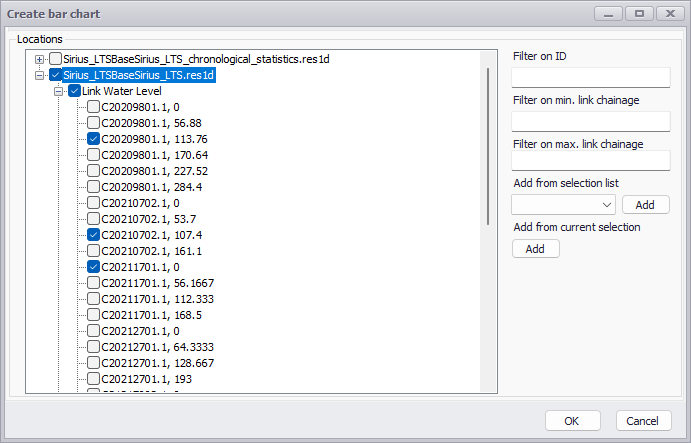
Figure: The 'Create bar chart' window
Choose the result file, result item and locations to plot from the list. Use the filters to search through the potentially long list of available locations, to filter on ID and/or chainages (chainage filtering being available only for link results from .res1d result files). One may also use a selection list (saved in the 'Selection manager') or the active selection, to select all items from the selected list.
Then click on the 'OK' button to create the chart.
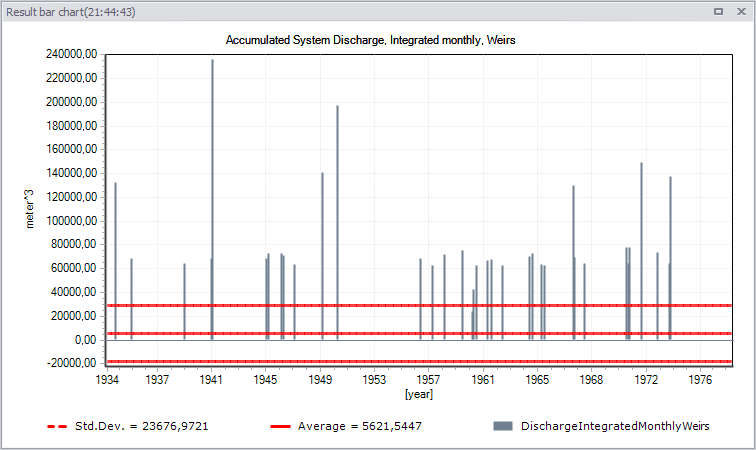
Figure: Example bar chart plot of monthly weir overflow volumes from LTS chronological statistics results
Customize the bar chart appearance via the Properties dialog accessed through the chart local context menu. The bar chart local context menu offers the following options:
- Zoom in, Zoom to full extent, Previous zoom, and Next zoom
- Save to plots manager: saves the bar chart (with its source result item) to the 'Plots' panel. The bar chart will initially be added to the active folder from this panel. See Plots Management chapter for more information on options to save and manage results windows
- Copy to clipboard
- Save to image file
- Properties
Bar Chart Properties
Format the bar chart through the Bar Chart Properties dialog. Set chart element properties in the various tab pages within the dialog.
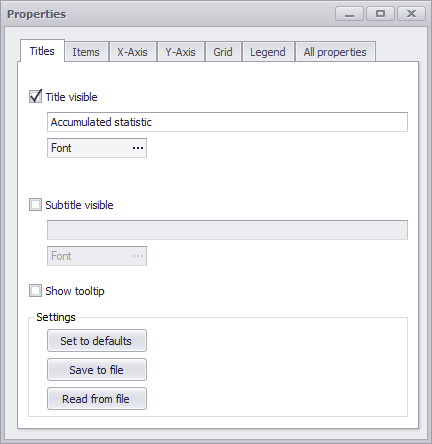
Figure: The Bar Chart Properties dialog
The sections below describe the various bar chart property options available on the Properties dialog.
Titles
- Title visible, Subtitle visible, Font. Options for adding and defining chart titles and subtitles, as well as customizing font types.
- Show tooltip. Option for showing a small "hover box" with information about a result item when hovering over it on the chart.
- Set to defaults. Reset chart properties to default values.
- Save to file. Option for saving bar chart configuration into a *.PFS file.
- Read from file. Option for loading bar chart configuration from an existing*.PFS file.
Items
- Visible. Activate/deactivate result items on the chart
- Use title in legend and Title. Customize Legend labels for result items on the chart
- Vertical axis (Left axis or Right axis). Option for defining the y-axis to use for result data on the chart.
- Show bar. Options for customizing the appearance of the result data series on the chart.
- Show marks, Show average, Show median. Option for showing annotation and additional information series on the chart, and customizing their appearance.
X-Axis
- Interval. For customizing x-axis bounds (i.e. interval).
- Reverse. Option for showing values in reverse order along the y-axis.
- User-define tick marks. For customizing the appearance of tick marks on the x-axis.
- Labels. Options for customizing labels along the x-axis, including font, orientation, and data format.
- Title. Option for defining x-axis title and font.
Y-Axis
- Interval. For customizing y-axis bounds (i.e. value range).
- User-define tick marks. For customizing the appearance of tick marks on the y-axis.
- Labels. Options for customizing labels along the y-axis, including font, and number of decimals.
- Title. Option for defining y-axis title and font.
Grid
- Vertical grid lines. Options for showing vertical grid lines on the chart area.
- Horizontal grid lines. Options for showing horizontal grid lines on the chart area, and defining the y-axis of reference.
- Style. For customizing the appearance of both vertical and horizontal grid lines on the chart area.
Legend
- Visible. Activate/deactivate the Legend on the chart
- Colorized text. Option to use the same color for label text as the data series in the Legend.
- Alignment. Option for defining the location of the Legend on the chart.
All properties
- This tab page collectively shows the various parameter configurations from the other tab pages in tabular format.