Reports

MIKE+ has facilities for setting up reports based on information from model data as well as simulation results. It is also possible to join information between different tables in the report.
The ‘Model and Result Report’ tool is found under the Tools ribbon. The tool uses a wizard approach for configuring reports.
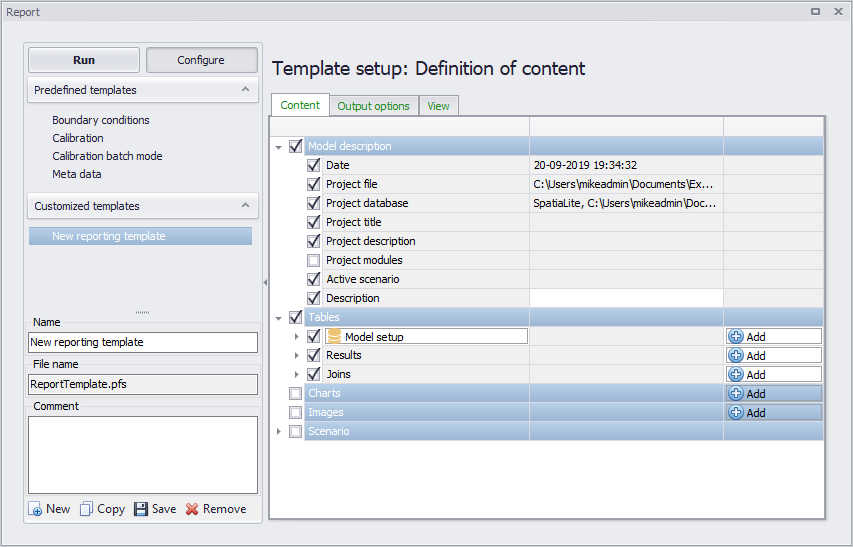
Figure: The MIKE+ Report editor
Setting Up a Report
The report tool generates reports based on configured templates. A list of templates is shown on the template navigator on the left panel of the editor. Templates are organized as:
- Predefined templates. Preconfigured report templates designed around typical reporting themes, such as:
- Boundary conditions
- Calibration
- Metadata
- Customized templates. User-configured report definitions.
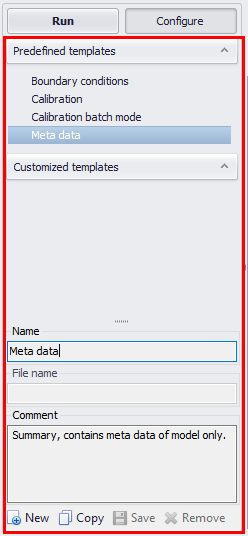
Figure: The template navigator on the Report editor
Set up a new custom report template with the ‘New’ button at the bottom of the panel. Specify a name for the custom template, and add a text description under ‘Comment’.
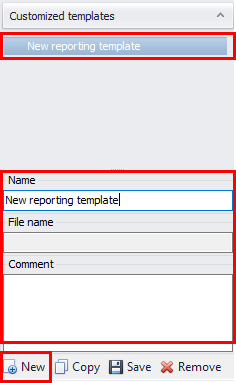
Figure: Defining a new custom report template
Content
On the Content tab page on the right panel (see figure below), it is possible to define contents for the report template setup:
- Navigate to the Content tab on the right panel
- Activate/deactivate items under each data group depending on content preferences for the report being set up. The available data groups are:
- Model description
- Tables
- Charts
- Images
- Scenario
- The ‘Add’ button allows adding information from MIKE+ model setup tables and loaded results, as well as adding charts and images.
- The ‘Remove’ button will delete items from the report setup.
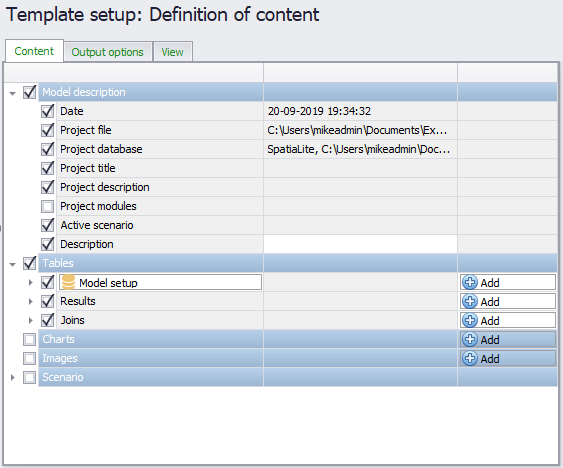
Figure: The report can contain information from the database tables as well as from result files
After choosing the tables to include, select which attributes of the data table you wish to add to the report (see figure below). The ‘Columns’ field provides a heading for columns in the report.
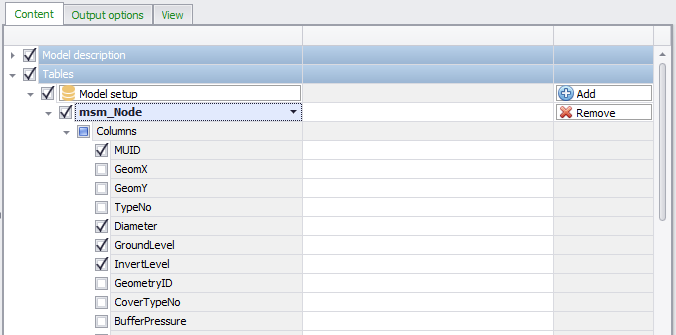
Figure: Specification of content from the table added to the report as well as the column title
Adding results information is done in a similar manner. It is necessary to have the result file loaded in the project beforehand (see figure below). When adding results you can choose to add summary statistics.
You can also specify reference values (i.e. ‘Values highlighted’) against which values will be compared in the report.
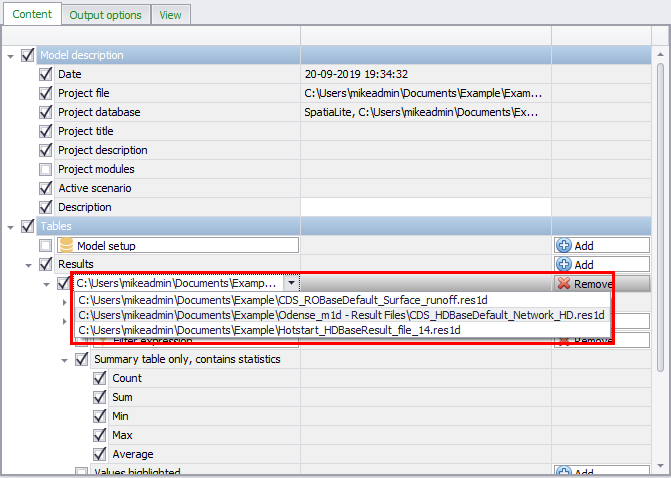
Figure: When adding result information to reports, you can choose to display summary statistics, e.g. average, maximum, etc.
Join of Tables and Results
It is also possible to combine data from two different tables into a joined table in the report.
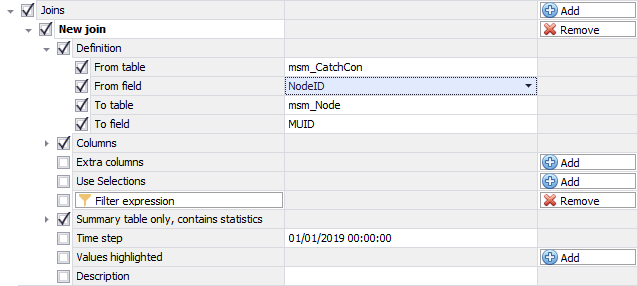
Figure: When joining tables you need to specify the common field in the two tables used for the join
Choosing the field with which to base the join: In the example shown in the figure above, the join is based on the ‘MUID’ in the msm_node table. The table that we wish to join information from is the msm_CatchCon table (containing the catchment connections information for the network model) - the field in this table to base the join on is ‘NodeID’. This means that the report will list all the catchments connected to each node.
Unmatched records will contain no values for fields being appended from the join table, e.g. if no catchments are attached to a specific node then the joined columns in the report will be left empty.
In the 'To table' list, it is also possible to select a result file, amongst the result files previously loaded into MIKE+. This can create a joined table containing both results and model data.
Statistical results (average value, maximum value, etc.) can be added to this table by activating 'Summary table only, contains statistics'. Instantaneous results from a given date and time can also be included, by activating 'Time step' and selecting the expected time step of the results.
Using Filters
If you wish to set up the report only to show information from selected elements, you can do so by specifying a filter.
You can use existing selection lists, or filter expressions. In the example shown in the figure below, a selection list (i.e. ‘Bell’) and a Field expression (i.e. [Diameter]>1) are used to qualify which nodes to include the report. If no filter is used, all elements are reported in the order they are extracted from the database.
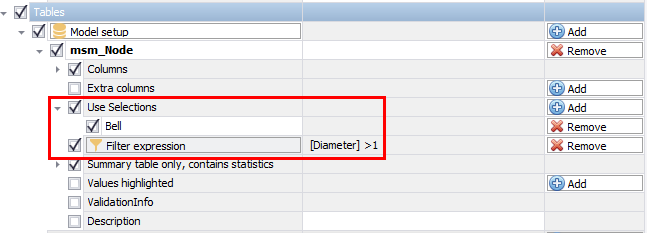
Figure: A report can be limited to only selected elements
Output Options
Configure report appearance and style in the Output Options tab page of the Report editor (figure below).
Reports can be generated in several formats, including HTML and CSV. Style sheets are used in generating the reports. MIKE+ comes with two different style sheets -- one for HTML format (MUReport.xsl) and one for CSV format (MUReportCSV.xsl). These default style sheets are installed in the Templates folder of your MIKE+ installation (i.e. the ‘Templates’ folder in the MIKE+ installation directory). It is also possible to use custom style sheets via the browse option in the tab page.
Title
Specify a title for the report in this input box.
Order
This panel lists the selected report items from the Content tab. The order of the items may be modified using the ‘Up’ and ‘Down’ buttons to the right of the panel to reorder the items on the list.
Style
Define the style sheet to use in generating the report. It can be selected from default styles sheets, or custom style sheets.
Target file name
File name and path for the XML file holding the report information that will be generated.
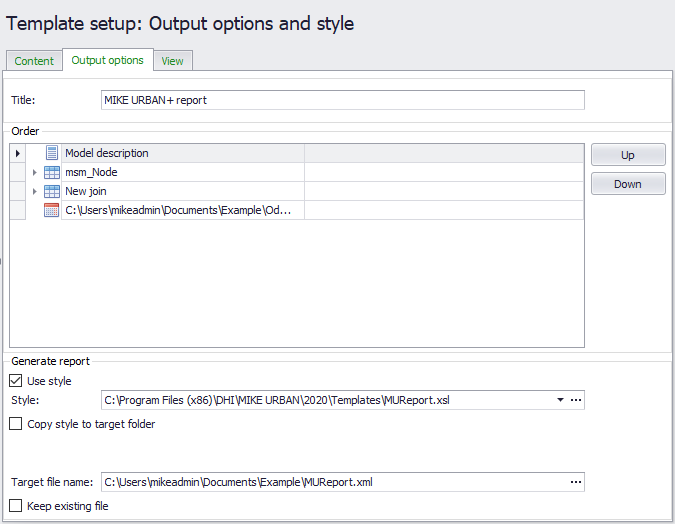
Figure: Specify the format of the generated report
Run the Report Setup
After defining the report content and format in the Content and Output Options tabs, respectively, execute the report configuration by clicking on the ’Run’ button on the left panel of the Report editor.
A preview of the generated report is then displayed on the View tab of the editor.
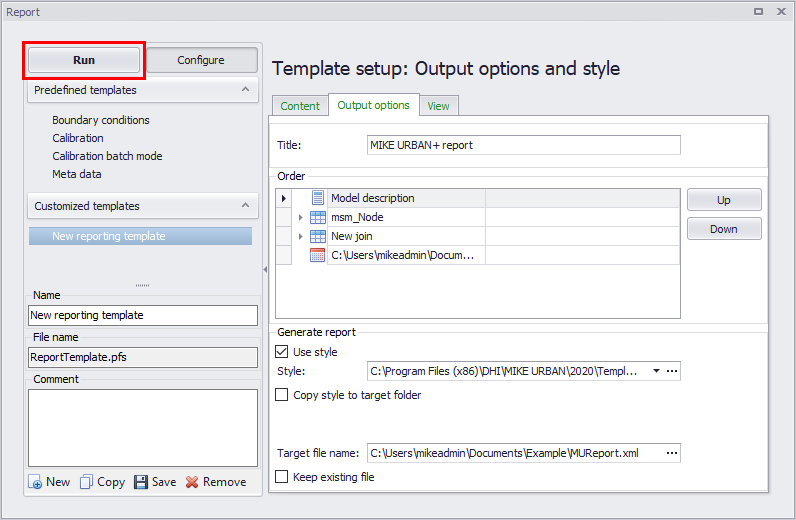
Figure: Run the report setup configuration
View
After running a report configuration, a preview of the generated report is displayed on the View tab of the Report editor.
Use the ‘Export’ button to save the generated report to various types of document formats(e.g. *.DOCX, ‘.PDF, ‘.HTML, ‘.CSV, among others).
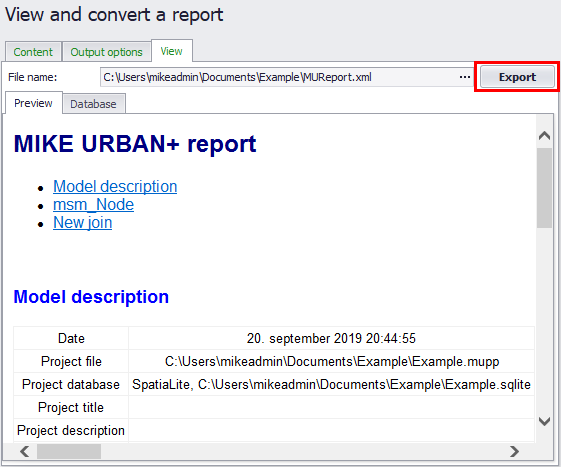
Figure: The View tab page presents a preview of the generated report
Save the Configuration File
Once the report layout is in place, it is recommended to save the custom report configuration so that it may be reused. Button functionalities on the template panel are described below:
Run
Executes a report template configuration.
Configure
Presents the Content and Output Options tab pages of the Report editor for modification. Predefined templates may not be edited.
New
Creates a new (custom) report template.
Copy
Makes a copy of an existing report template (e.g. predefined template) and adds it to customized templates list.
Save
Saves a custom template into a *.PFS file.
Remove
Removes an item from the customized templates list.