Project Menu
The Project menu offers additional quick access to the different Views as well as to general tools and functionalities grouped under toolboxes.
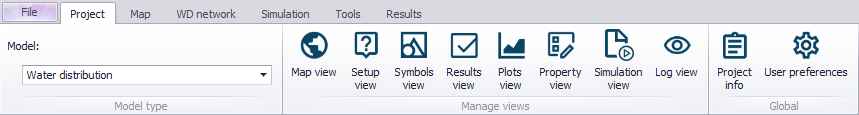
Figure: MIKE+ Project menu ribbon
Model Type
This toolbox allows you to switch from one model type/mode to another amongst the following list:
- Rivers, collection system and overland flows
- SWMM5 rivers and collection system flows
- Water Distribution
Manage Views
This toolbox manages the views of the model records and divides it into six different tabs and menus.

Map View
To view the main Map, click on Project | Map view. Access the local context menu from the Map to access options to:
- Recreate overview
- Run database validation
- Show validation items on map
- Show feature fly-by when interactive
- Refresh boundary visualization
- Clear flags and paths
- New selection list from map
- Add bookmark
- Show bookmarks
- Reset toolbars. Option for resetting the toolbars shown on the top border of the Map.
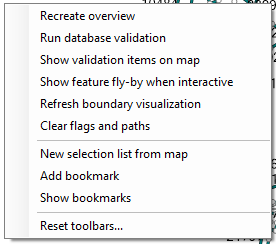
Figure: Access the main Map local context menu by right-clicking on the Map

Setup View
The setup view provides data validation that can allow you to quickly examine the model data as shown in the figure below.
- Green ticks: all OK
- Red crosses: Some data is incomplete or incorrect
Figure: Example of data validation in the Setup view

Symbols View
This presents the Layers and Symbols panel where you can customise the model layers and visualise the different components as desired by colour coding each component. In this panel you can add a new layer i.e. shapefile or results layer to the Map, which will allow a better visualisation of the model results and the network overall.

Results View
Once a simulation is complete the result file will be automatically added into the Results manager, unless this automatic loading is disabled in the User preferences window. This panel allows you to manage result files and visualise simulation results in various ways. See Results Presentation chapter for more information on how to display results from this list of result files.
![]()
Plots View
This opens the 'Plots' panel where result views (e.g. time series plots, maps, etc.) may be saved and organized, to be re-opened at a later stage without having to re-configure the results selection and symbology customization. See Plots Management chapter for more information.

Property View
This opens the Property and Result Explorer. When you want information about a feature displayed on the Map, you can use the ‘Identify’ tool and information about the selected feature on the Map is displayed in the Property and Result Explorer.
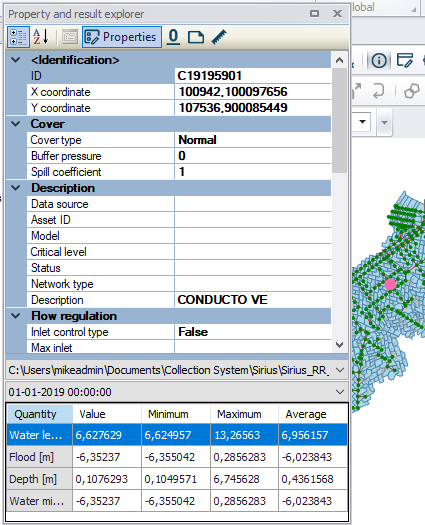
Figure: Property And Result Explorer showing properties of the feature highlighted (in pink) on the Map

Simulation View
A Simulation view shows a panel displaying the content of the simulation's log file as reported by the simulation engine. The same content is written to a file on the disk during the simulation, and can be retrieved even after closing the software.
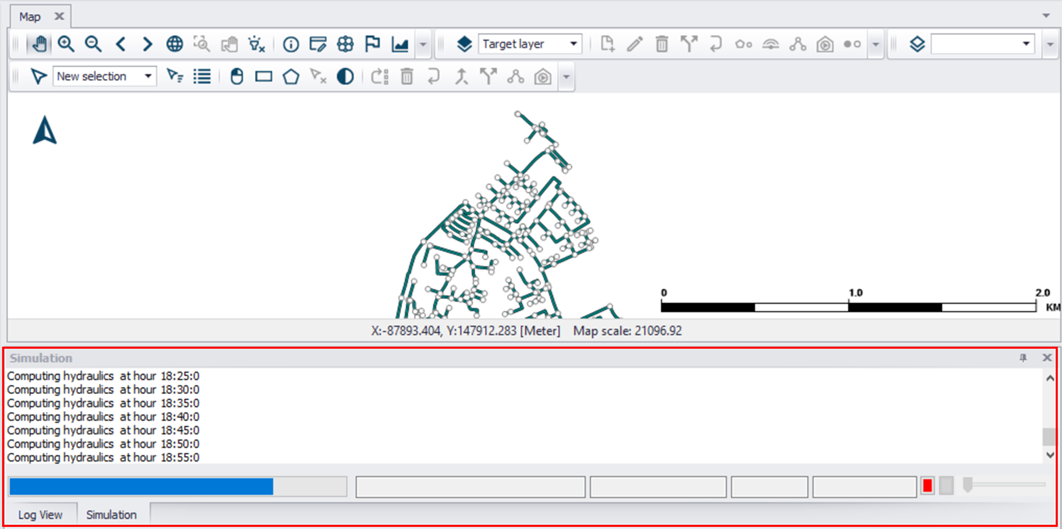
Figure: MIKE+ Simulation View shown at the bottom of the interface

Log View
A log view shows a panel displaying information on data processing, such as data import or error messages.
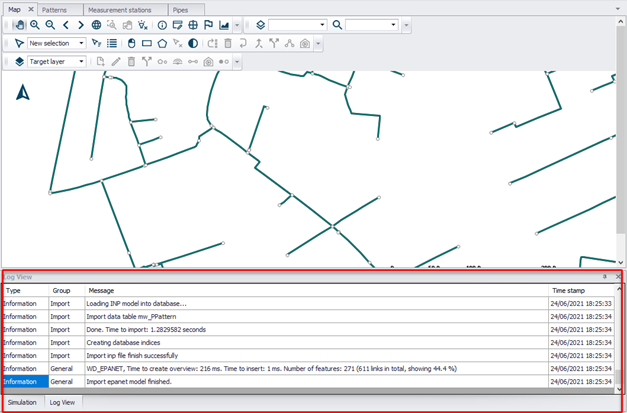
Figure: MIKE+ Log View shown at the bottom of the interface
Global

Project Info
This provides general information on the project and model components, such as number of nodes, number of pipes, project database type, etc.
Figure: MIKE+ Project Information window
![]()
User preferences
Provides options for customizing general program behaviour, e.g. Automatic loading of results, language, etc. See User preferences