Plots Management
The 'Plots' panel allows saving and organizing all types of result presentation windows (hereby referred to as plots) for later reuse: time series plots, results tables, result maps, etc. This also applies to profile plots even when they do not include any result layer.
All plots can be organized in folders, created with the 'New folder' button at the top of the panel or from the context menu. Plots and folders can be dragged and dropped to re-organize the lists.
The plot type can be identified based on the plot's icon which is identical to buttons from the 'Results' tab in the ribbon.
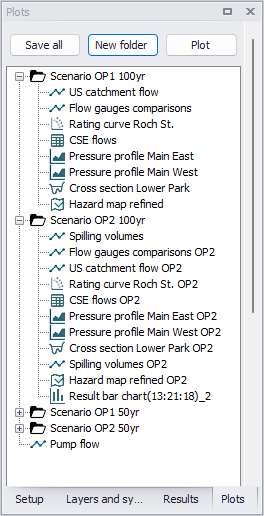
Figure: The Plots panel with several result plots saved in various folders
There are two ways to save a plot to the Plots panel:
- Use the 'Save to plots manager' option from the plot to be saved: if the plot already exists in the panel, it will be saved again with its updated settings (e.g. changes of result items, or changes to symbols). If it does not already exist, it will be added to the active folder.
- Use the 'Save all' button at the top of the panel: this will save all open plots. Plots which already exist will be saved with their updated settings whereas others will be added to the active folder.
The following options can be used to open a saved plot:
- Double-click on the plot name
- Use the 'Plot' button at the top of the panel to open the selected plot
- Press the Enter key to open the selected plot
- Use the 'Plot' option in the context menu, after right-clicking on the plot name.
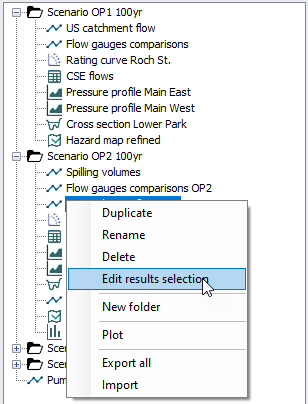
Figure: The context menu of the Plots panel
Additional options are available from the context menu (right-click on a plot or folder). These are:
- Duplicate: creates a copy of the selected plot, or the selected folder with all its content.
- Rename: renames the selected plot or folder.
- Delete: deletes the selected plot, or the selected folder with all its content. This operation can be canceled using the Ctrl+Z keys, right after the deletion.
- Edit results selection: this is only available for time series plots, profile plots and scatter plots. It opens an editor where the list of result items and locations can be edited prior to displaying the results. This e.g. allows to re-use existing plots with alternative result files, by duplicating the plot and then editing its input result file. See following chapters for more details.
- New folder: adds a new folder to the list. New folders are initially created at the bottom of the tree, but can later be moved by click-and-drag.
- Plot: opens the window corresponding to the selected plot. Using the 'Plot' action on a folder opens all plots in this folder.
- Export all: saves the content of the Plots panel (list of plots and folders) along with the plots' settings (result items, symbols, etc.) to a text file, which can be imported afterwards in another MIKE+ project.
- Import: imports the list of plots and folders from a text file saved from another MIKE+ project. This appends the content of the text file to the existing plots in the panel, when they have different plot names or folder names. If a plot in the file has the same name and the same folder location as an existing plot, then it is overwritten with the file's settings. Note that, in this text file, locations of result files are saved using paths relative to the location of the text file itself: it is therefore mandatory that the relative locations of the text file and result files are preserved, so that links to result files are restored while importing the text file again.
Note
Although two plots can be given the same name (which may e.g. be expected when similar plots are used in different folders), it is recommended to use unique names for each plot, because it is not possible to open multiple plots with the same name at the same time.
Editing time series plots
The 'Edit results selection' option opens the editor below for time series plots.
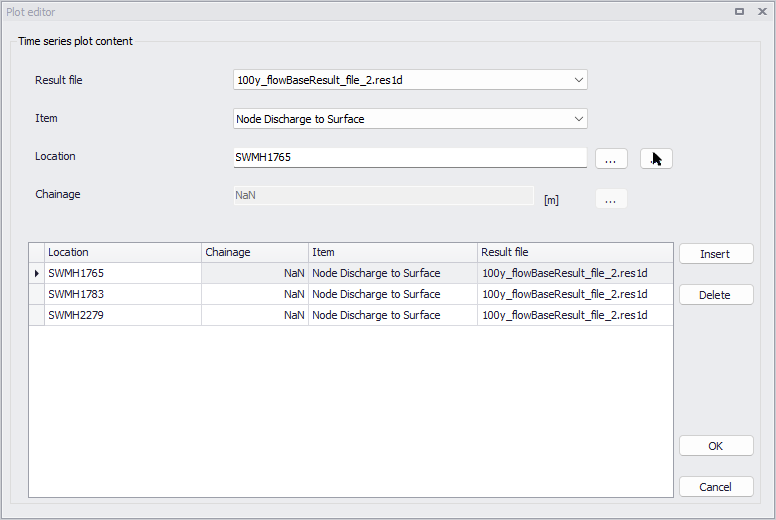
Figure: The Time Series Plot Editor
The overview table shows the list of time series included in the time series plot, while the above fields show the same properties for the selected record in the table. Time series can be added or removed from the plot using the 'Insert' and 'Delete' buttons on the right.
Each time series is defined with the following editable properties:
- Result file: this is the file name of the source result file. It is possible to select from the list of files currently loaded in the MIKE+ project from the drop-down list.
- Item: this is the type of result item. It can be selected from the drop-down list, which shows all items currently loaded in the MIKE+ project for the selected file.
- Location: this is the item ID where the time series is picked from, e.g. node ID, link ID, or catchment ID. This ID can be typed manually, selected from a list using the '…' button or picked from a map using the arrow button.
- Chainage: this is the chainage along the selected link where the time series is picked from. It can also be picked from a map using the arrow button This field is active only for relevant result types.
These properties can be edited for multiple records at once using the Field calculator which is available by right clicking on a column's header. An expression editor is then available where simple or complex expressions can be written to edit selected rows. If no rows are selected, the expression will be applied to the entire column. See Expression Editor for more information.
Click OK to save the changes, and the time series plot will show the updated time series definitions the next time it is opened.
Note
The [FilePath] variable defining the source result file is a path, and not a simple file name. While the tool can in some cases succeed converting a simple file name to a path, it may be necessary to specify the full path to result files in the Field calculator.
Editing profile plots
The 'Edit results selection' option opens the editor below for profile plots.
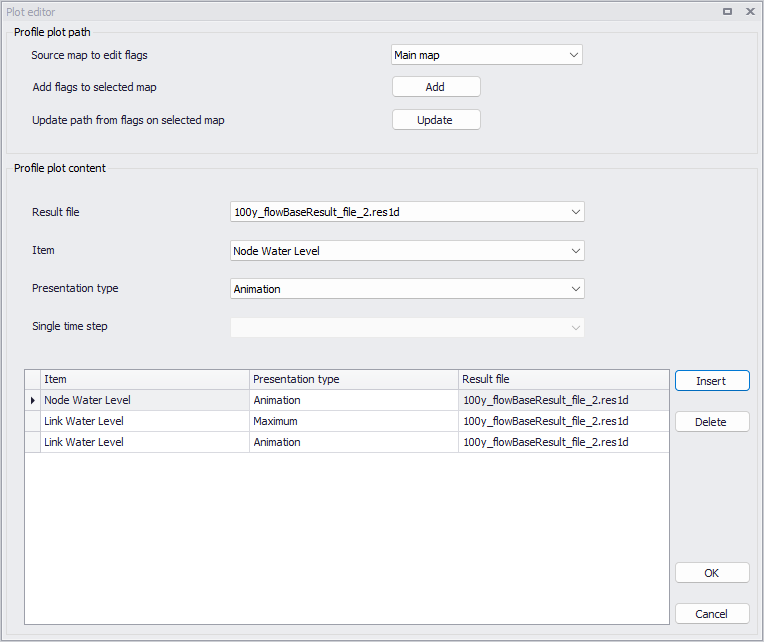
Figure: The Profile Plot Editor
The upper part of the editor allows editing the path of the profile plot on a map. The list 'Source map to edit flags' shows the map where the profile plot was defined and where flags can be edited. 'Main map' indicates that the plot was created on the model map, and this cannot be changed. When the profile plot was created from a result map, this list shows the name of this result map, and it is possible to select another result map to edit the location. It is not possible to change this selection from the main map to a result map or vice-versa.
To edit the path, click 'Add' to show the original flags on the selected map, where it is then possible to add, delete or re-order the flags. When changes to the flags definitions are done, click 'Update' to save the new flags in the edited profile plot.
The overview table shows the list of result items added to the profile plot, while the above fields show the same properties for the selected record in the table. Result items can be added or removed from the plot using the 'Insert' and 'Delete' buttons on the right.
Each result item is defined with the following editable properties:
- Result file: this is the file name of the source result file. It is possible to select from the list of files currently loaded in the MIKE+ project from the drop-down list.
- Item: this is the type of result item. It can be selected from the drop-down list, which shows all items currently loaded in the MIKE+ project for the selected file.
- Presentation type: this controls the type of presentation for the result item on the plot, which can be Average / Maximum / Minimum / Animation.
- Single time step: this shows the date and time of the result item. This field is active only for relevant result types.
These properties can be edited for multiple records at once using the Field calculator which is available by right clicking on a column's header. An expression editor is then available where simple or complex expressions can be written to edit selected rows. If no rows are selected, the expression will be applied to the entire column. See Expression Editor for more information.
Click OK to save the changes, and the profile plot will show the updated results definitions the next time it is opened.
Note
The [FilePath] variable defining the source result file is a path, and not a simple file name. While the tool can in some cases succeed converting a simple file name to a path, it may be necessary to specify the full path to result files in the Field calculator.
Editing scatter plots
The 'Edit results selection' option opens the editor below for scatter plots.
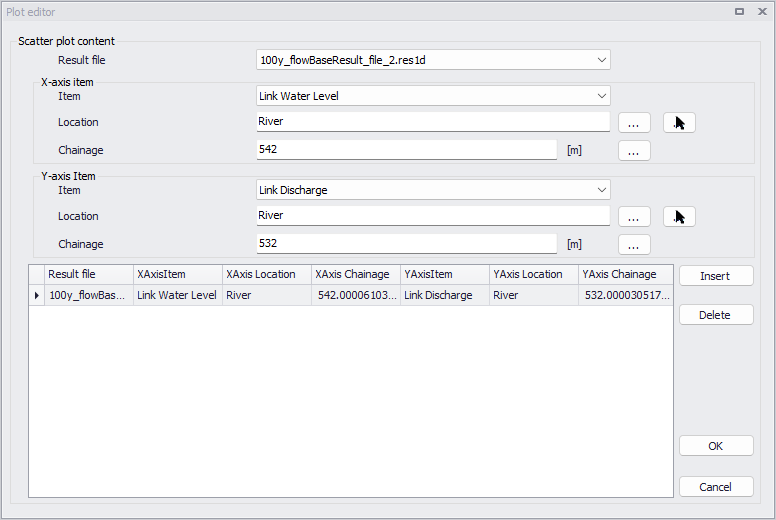
Figure: The Scatter Plot Editor
The overview table shows the list of scatter point series included in the scatter plot, while the above fields show the same properties for the selected record in the table. Series can be added or removed from the plot using the 'Insert' and 'Delete' buttons on the right.
Each scatter point series is defined with the following editable properties:
- Result file: this is the file name of the source result file. It is possible to select from the list of files currently loaded in the MIKE+ project from the drop-down list.
- Items: this is the type of result item, to be selected separately for the X and Y axes. It can be selected from the drop-down list, which shows all items currently loaded in the MIKE+ project for the selected file.
- Locations: this is the item ID where the axis data are picked from, e.g. node ID, link ID, or catchment ID, to be selected separately for the X and Y axes. This ID can be typed manually, selected from a list using the '…' button or picked from a map using the arrow button.
- Chainages: this is the chainage along the selected link where the axis data are picked from, to be selected separately for the X and Y axes. It can also be picked from a map using the arrow button. This field is active only for relevant result types.
The result file property can be edited for multiple records at once using the Field calculator which is available by right clicking on the column's header. An expression editor is then available where simple or complex expressions can be written to edit selected rows. If no rows are selected, the expression will be applied to the entire column. See Expression Editor for more information. The other properties can only be edited from the upper form, but not from the overview table.
Click OK to save the changes, and the scatter plot will show the updated time series definitions the next time it is opened.
Note
The [FilePath] variable defining the source result file is a path, and not a simple file name. While the tool can in some cases succeed converting a simple file name to a path, it may be necessary to specify the full path to result files in the Field calculator.