User-specified "Observation Period"
"Observation Period" is calculated as the difference between the simulation end date/time and start date/time by Default. But sometimes, the simulated period is not continuously covered by boundary data and therefore these "empty" intervals do not contribute to the statistics.
In the bar chart example in Figure "Chronological yearly statistics displayed as bar chart", the period between 1943 and 1952 (ten years) is not covered by rainfall data and no statistics are available for these years. In some of the other years, there are no reported results in the graph, but this is due to the actual simulations, and not due to the absence of boundary data.
To compensate for missing intervals (i.e. to calculate the exceedance frequency with the correct time base), the default "Observation Period" can be overwritten by a user-specified value:
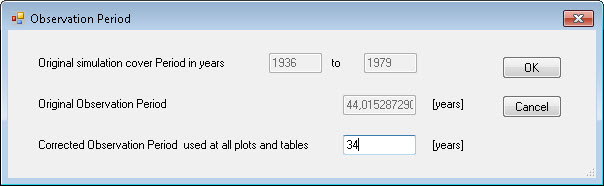
Figure: LTS Observation Period dialog
The Observation Period dialog is accessed via the “LTS user period” button in the Result Time Series window that appears when loading a result file. The option is only available for LTS extreme events statistics results.
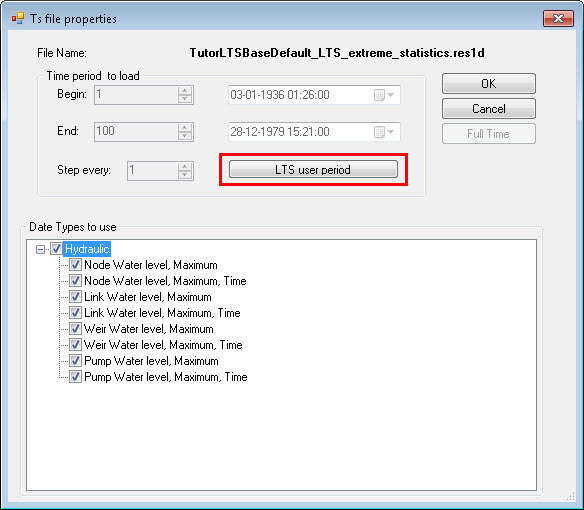
Figure: The LTS User Period button in the Timeseries File Properties window that appears when loading LTS extreme events statistics results