Create Flood Maps Tool
Introduction
The purpose of the 'Create flood map' tool is to convert 2D result files into a polygon layer, where each polygon represents a group of neighboring cells with the same category of results (e.g. same class of water depth). All resulting polygons are saved in a unique shape file.
2D result files in both flexible mesh format (.dfsu file) and rectangular grid format (.dfs2 file) are supported, no matter if the latter format is obtained from a 2D overland simulation or 1D river simulation.
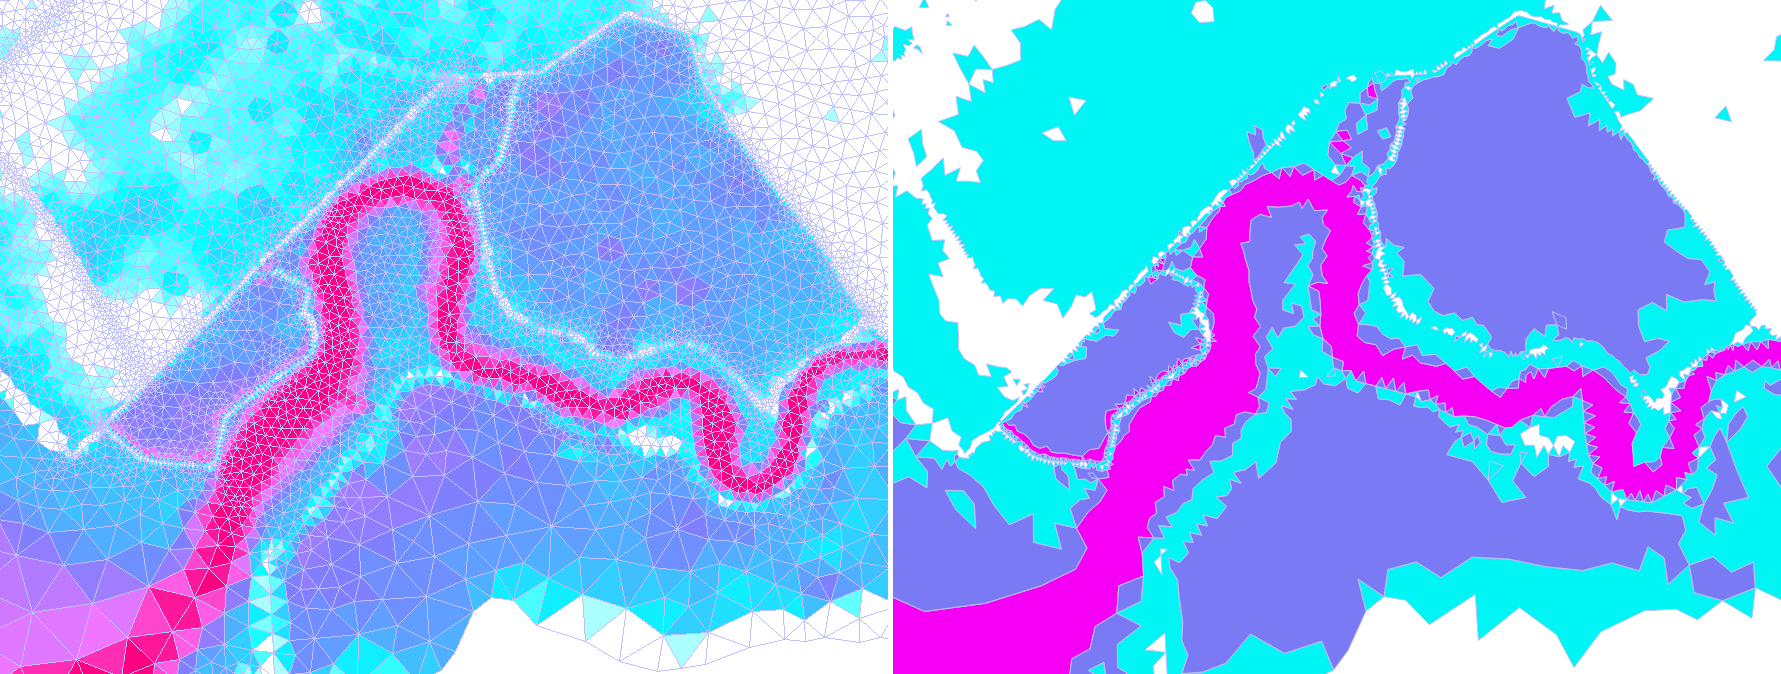
Figure: Comparison of original flood depth results (left) and created polygons with three depth categories (right)
The tool also offers some filters to remove or merge polygons which may be considered too small compared to the level of analysis expected from the output map.
Main settings
The tool processes a selected result item at a selected time step, to create the polygon layer based on user-defined categories.
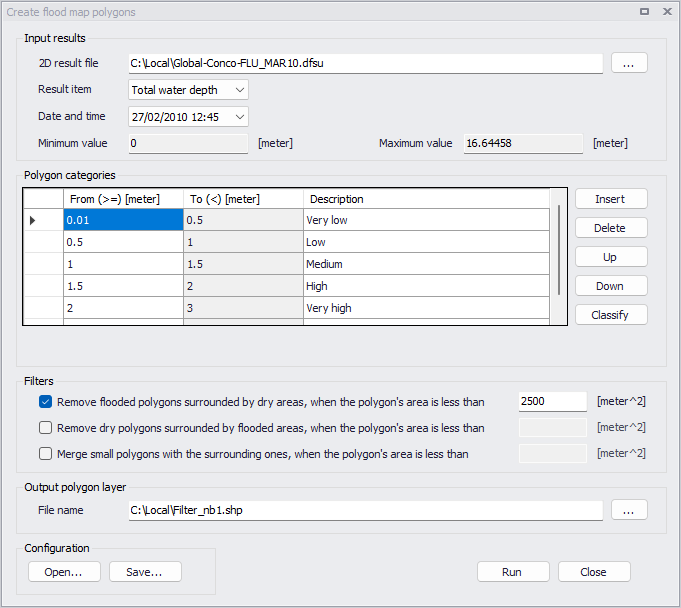
Figure: The Create flood map tool
Input results
Selection of results data is made in the 'Input results' group:
- 2D result file: the path to the input result file.
- Result item: the result item to be processed, from the selected result file.
- Date and time: time step at which the results should be processed, selected from the list of time steps available in the result file.
Minimum and maximum values in the result file for the selected result item and time step are shown to help defining the polygon categories.
Note
In case the polygons have to be created from statistical results (typically the maximum values), it is necessary to select a result file containing these statistical results with a single time step. Such result files can be saved during the simulation, or by post-processing an animated result file with instantaneous results.
Polygon categories
The categories are specified in the table, using the 'From' column. Values in the 'To' column are automatically filled in.
The first 'From' value can be used to exclude very small results from the polygons. For instance, for water depth results, if the first category starts at 1 cm, then all areas with depths lower than this threshold will not be mapped in the output shape file (no polygon will contain these areas).
There is however no upper limit for the last category, and its 'To' value therefore always shows the infinity symbol.
It is recommended to provide meaningful descriptions or names of the categories in the 'Description' column. All three columns will be saved as attributes of the polygons in the output shape file.
The buttons on the right side of the table can be used to add, remove or re-order the categories in the table.
The 'Classify' button opens a dialog to define the number of categories to use and the 'From' values for each class. In this dialog, the 'Distribute using min/max from data set' button distributes equidistantly the specified number of categories using the minimum and maximum values of the selected result item and time step. The 'Distribute using first/last from table' button distributes equidistantly the specified number of categories using the first and last custom values specified in the table in this classification window.
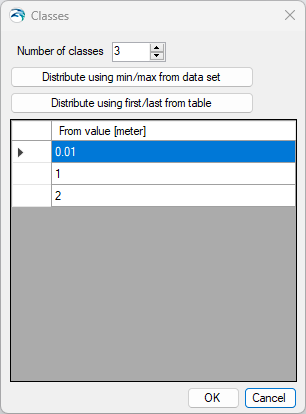
Figure: Customizing value classes for the categories
Output polygon layer
This group holds the path and name of the output shape file.
Configuration
Once the tool has been configured, it is possible to save its configuration to a file using the 'Save…' button for later re-use. This configuration can later be loaded again using the 'Open…' button, or can be used to execute the tool from a command line.
Filters
Filters can optionally be used to remove or merge polygons which may be considered too small for the expected analysis of the output map. Their goal is to get rid of very small local variations of categories, to only focus on larger-scale variations.
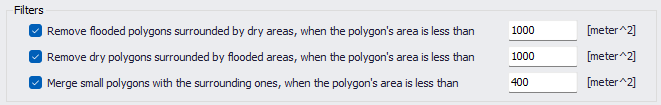
Figure: List of available filters
For each of the filters, polygons are filtered only when their area is smaller than the specified threshold.
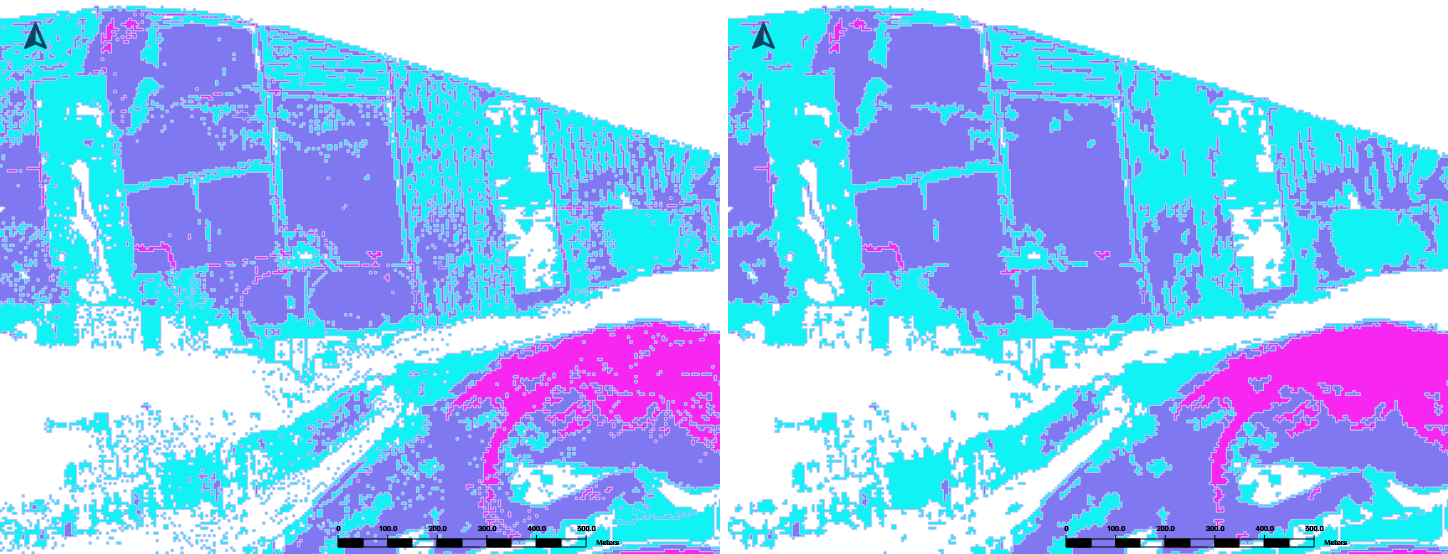
Figure: Comparison of flood hazard categories without filters (left) and with filters (right)
When several of these filters are active, the data processing associated to them is performed in the order of the filters shown in the tool (from top to bottom).
Remove flooded polygons surrounded by dry areas
This first filter helps removing small isolated flooded areas which are disconnected from a main flooded area.
Such small areas may arise e.g. due to rainfall accumulating in small ponds, in which case they are not of interest for a flood map, or due to artefacts of interpolation of river water levels on a DEM in which case they may not be realistic.
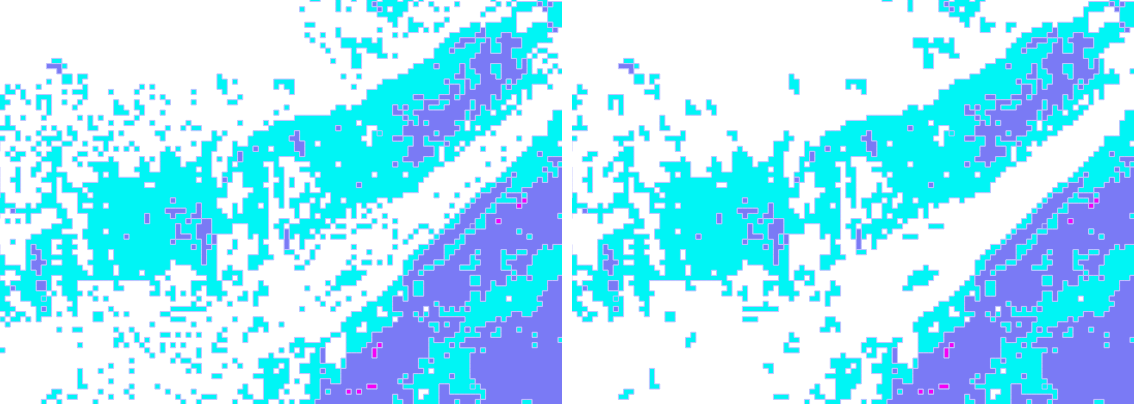
Figure: Comparison of flood hazard categories without filters (left) and with first filter (right)
The tool will first create category polygons by gathering neighboring cells / elements with result values in common categories. Once the polygons are created, and if this filter is active, the tool will search for isolated polygons and remove those which have their area smaller than the specified threshold.
A polygon is declared as isolated when it doesn't share any segment of its borders with another polygon. Note that two polygons will not be considered as sharing a border if they only share a single point location (this may especially occur with rectangular grid results, when flooded cells are connected only through their corner). A consequence of this approach is that a flooded area can only be removed if it is included in a single category.
Note
This filter is solely based on a spatial analysis and can remove polygons from different categories, although such isolated areas are usually areas with low depths / risks. An alternative way to skip areas with low depths / risks is to exclude low value results from the analysis by increasing the 'From' value of the first category.
Remove dry polygons surrounded by flooded areas
This second filter helps filling small gaps within flooded areas.
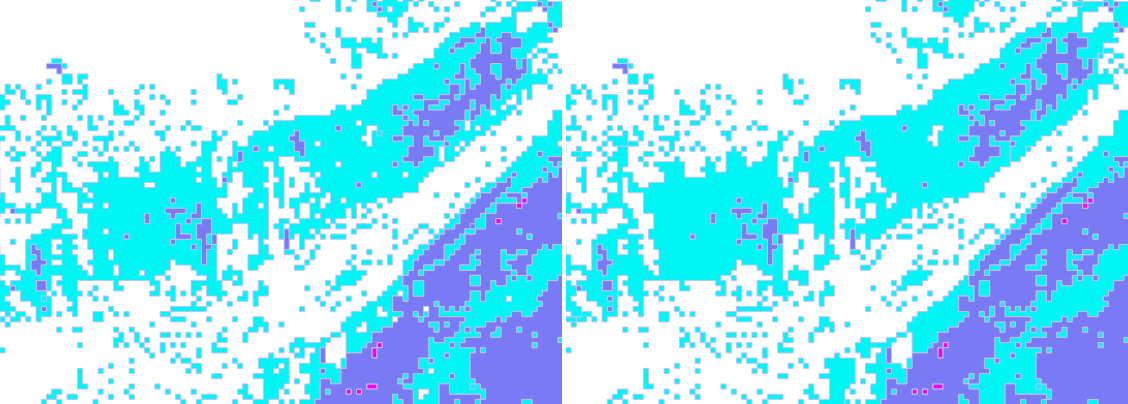
Figure: Comparison of flood hazard categories without filters (left) and with second filter (right)
If this filter is active, the tool will search for gaps / holes within the polygons (white holes in above figure) and remove those which have their area smaller than the specified threshold.
When the gap is contained within a single polygon / category, the area of the gap becomes included in this category, i.e. this area is given the category of the surrounding polygon. If the gap is at the junction between multiple categories, it is given the lowest category from all neighboring polygons (lowest 'From' value).
Note
Gaps are here defined as dry cells / elements, within a larger flooded area. When working with flexible mesh results, this filter therefore only acts on areas which are part of the mesh. Areas excluded from the mesh (typically buildings) are not filled.
Merge small polygons with the surrounding ones
This third filter merges small polygons having a local category with a neighboring (wider) polygon. This means that these small polygons are removed and replaced by the category of the neighboring polygon. The purpose is to ignore very local variations of the risk which may not be of interest for the flood map.
This filter acts only on polygons which are fully surrounded by other polygons. It does not merge polygons located on the edges of a flooded area.
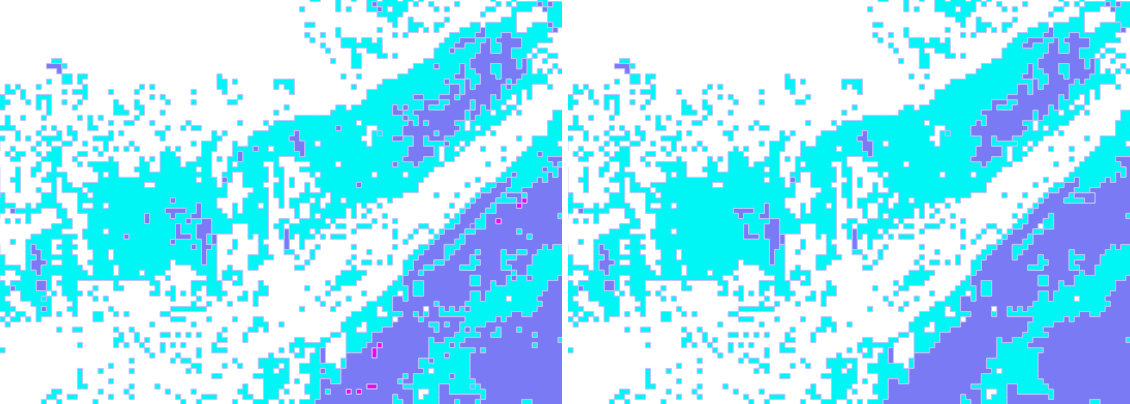
Figure: Comparison of flood hazard categories without filters (left) and with third filter (right)
The tool will first create category polygons by gathering neighboring cells / elements with result values in common categories. Once the polygons are created, and if this filter is active, the tool will search for small polygons which are completely surrounded by other polygons: those which have their area smaller than the specified threshold will be merged with a neighboring polygon.
When the polygon to be merged is contained within a single polygon / category, it is merged with this surrounding polygon. If the polygon to be merged is at the junction between multiple categories, it is given the lowest category from all neighboring polygons (lowest 'From' value).
Running the tool from command lines
MIKE+ user interface is usually the preferred way to execute this tool. However, there are times when it may be more convenient to execute the tool in an automated way without opening it in the user interface.
The MIKE+ executables enable you to execute some tools without opening their editor, through command lines. It is possible to run the 'Create flood map' tool in this manner, assuming you have prepared the configuration file beforehand in MIKE+.
Start by locating the MIKE+ executable named DHI.MIKEPlus.ToolShell.exe in the installation folder. From a command prompt, type the command below to access the list of supported tools, replacing the … characters by the actual path to the file:
The format of the command for running the 'Create flood map' tool is:
Where [Configuration file] is the path to the *.xml configuration file.