Scatter Plot
The scatter plot shows a graphical presentation of the relationship between any two result items from a common result file. It can e.g. plot Q/H relations in rivers or pipes, level-volume relations in tanks, flow/pressure relations in pumps, etc. In this plot, every point represents a different time step saved in the result file. This is only available for 1D network results.
To create a new scatter plot, right-click on the result file or one of its result items in the list of result files, or use the 'Scatter plot' button in the ribbon.
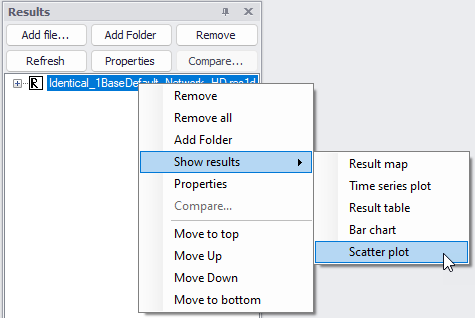
Figure: Creating a scatter plot from the list of result files
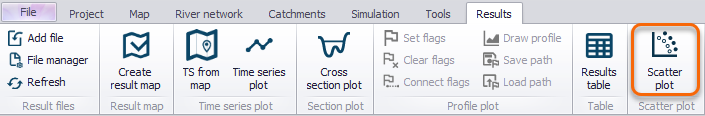
Figure: 'Scatter plot' option on the Results ribbon
Both options will open the 'Add scatter plot' window below.
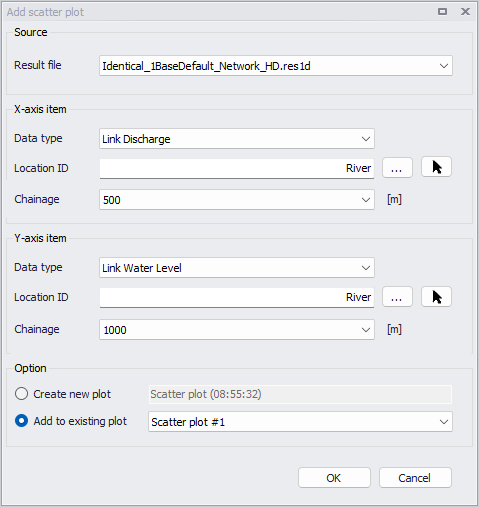
Figure: The 'Add scatter plot' window
Choose the result file result file to pick results from. Then for each axis, select the item type and location to plot.
Select between the two options:
- 'Create new plot': the new result data will be shown in a new window, named with the specified title.
- 'Add to existing plot' options: the new result data will be shown in the selected existing scatter plot.
Then click on the 'OK' button to create the scatter plot. This will plot the results in the scatter plot window.
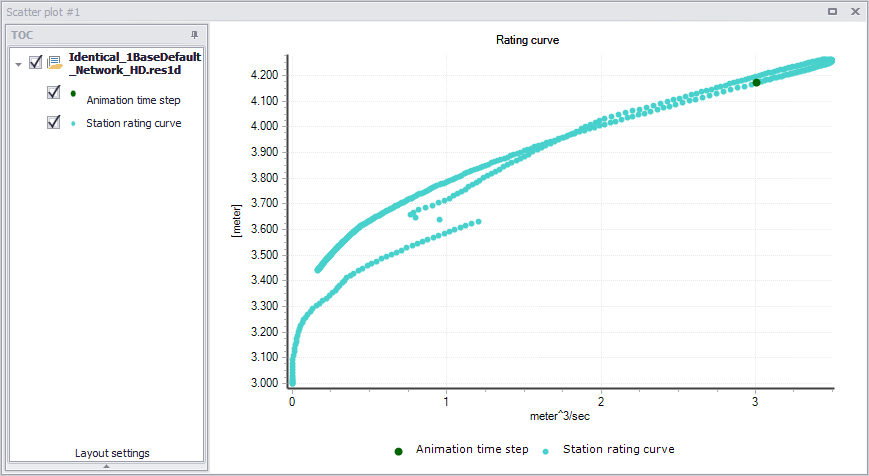
Figure: The scatter plot window
Once a scatter plot is created, additional result time series can be added to the plot in various ways:
- Right-click in the table of content of the scatter plot and select 'Add items'
- Use the 'Add scatter plot' tool again, with the option to add the new results to an existing plot
- Add result items from another scatter plot, using the Copy / Cut / Paste options in the context menu of the table of content.
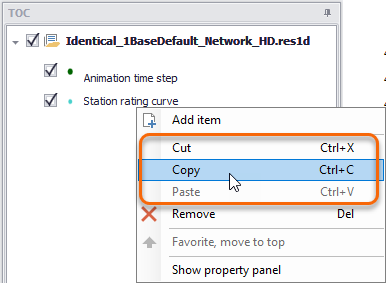
Figure: Options to copy and paste scatter plots from one plot to another
Data series format
To customize the appearance of a scatter plot series, right-click on a data series and activate the 'Show property panel' option from the local context menu.
Options for configuring data series appearance include customizing line color and style, adding markers, and changing marker styles and size.
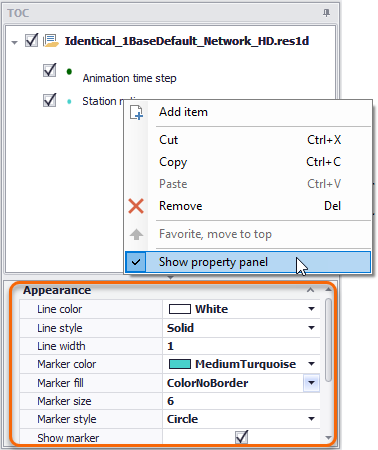
Figure: Customize the appearance of scatter plot data series via the Property panel
Context menu
Right-click on the scatter plot to access options to control the zoom level, copy data or export to an image file.
'Zoom in' lets you draw a rectangle on the plot to select the area to zoom to. While drawing a rectangle, dragging to draw a horizontal line will display arrows to zoom along the horizontal axis only, keeping the vertical axis unchanged. Similarly, dragging to draw a vertical line will zoom along the ver-tical axis only. 'Zoom to full extent' brings you back to the full view of visible data. Note that additional options are available to control the zoom options:
- Hold down the Shift key, to zoom in
- Scroll with the mouse wheel to zoom in or out
- Hold down the Ctrl key to pan.
'Open time series…' opens a Time Series Plot showing two time series for each scatter plot series, respectively representing the items plotted on the X-axis and on the Y-axis of the scatter plot.
‘Swap X and Y axis items’ swaps axes data so that the result item initially plotted on the X axis is then plotted on the Y axis and vice versa.
'Save to plots manager' will save the scatter plot's content (list of result items and locations, and display settings) to the 'Plots' panel. The scatter plot will initially be added to the active folder from this panel. See Plots Management chapter for more information on options to save and manage results windows
'Copy plot to clipboard' will copy the plot as an image in memory, to be pasted in another program. 'Copy data to clipboard' will copy the scatter plot values in memory, to be pasted in another program.
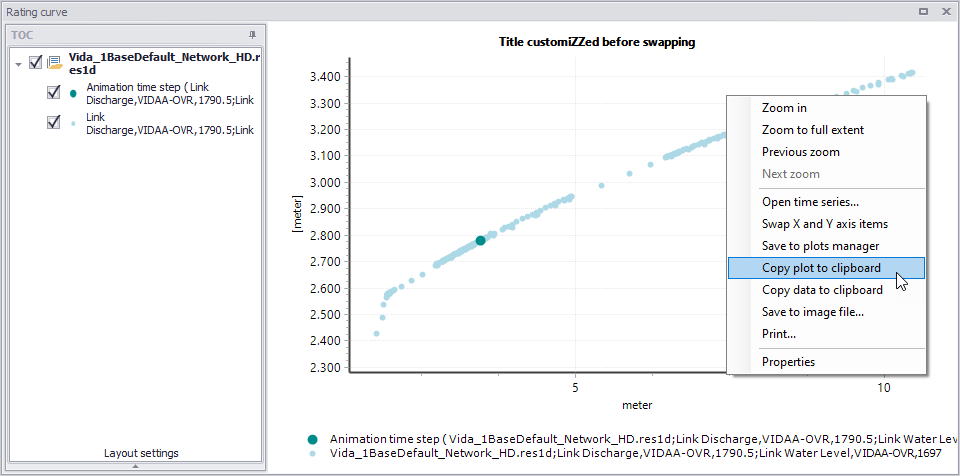
Figure: Context menu of the scatter plot
The context menu also offers a 'Properties' option to control the layout and the symbology of the scatter plot.