Fire Flow Analysis
The Fire Flow Analysis module allows you to calculate the available flow for the design pressure or to calculate the residual pressure for the design flow. Fire flow requirements are one of the most common design requirements when designing the new or evaluating the existing water supply and water distribution system.
A fire flow is the maximum flow rate available at a specific minimum pressure, typically 20 psi (15 m). There are three basic ways to model a fire flow:
- Specify a design fire flow rate and compute the available fire flow pressure.
- Specify a design fire flow pressure and compute the available fire flow rate.
- Compute both hydrant discharge and residual pressure for a free discharge hydrant.
A unique feature of MIKE+ is its capability of computing a fire flow for fire hydrants that are not part of the hydraulic model and that can be specified by using a reference GIS file.
The 'Fire flow analysis' editor is available after activating the ‘Fire flow analysis’ option in the 'Model type' editor. The 'Fire flow analysis' entry will then become visible in the 'Setup' view, under the 'Special Analyses' group.
A list of the Fire Flow Analysis attributes follows, with a short description given for each one. Note, that it is possible to insert multiple fire flow analysis, each with its own settings, and then run the selected fire flow simulation by selecting it from the list. This is convenient when you need to investigate fire flow capacity of the network under different conditions.
Main buttons
The following buttons are avaiable at the top of the editor:
- Insert: This button is used to insert a new Fire flow analysis into the list
- Delete: This button is used to delete a Fire flow analysis from the list
- Run: This button is used to run the simulation for the active Fire flow analysis
- Stop: This button is used to stop the fire flow analysis that is currently running
- Report: This button is used to generate a report from the fire flow simulation.
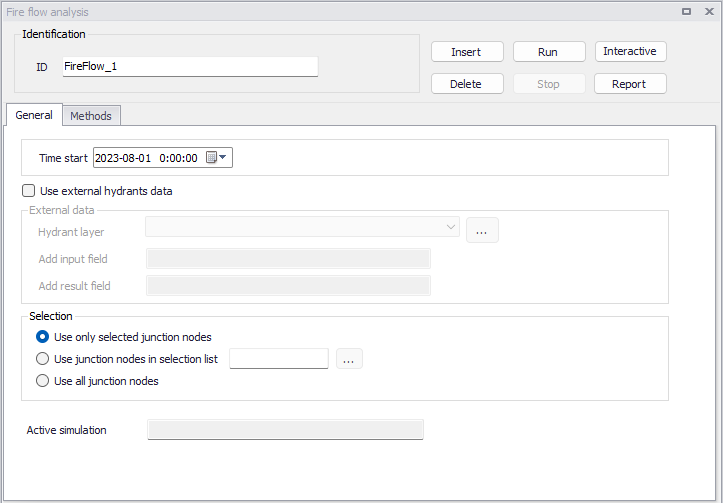
Figure: The 'Fire flow analysis' editor
Interactive mode
Using the ‘Interactive’ button it is possible to run the fire flow simulation interactively with simplified data entry for a specific node.
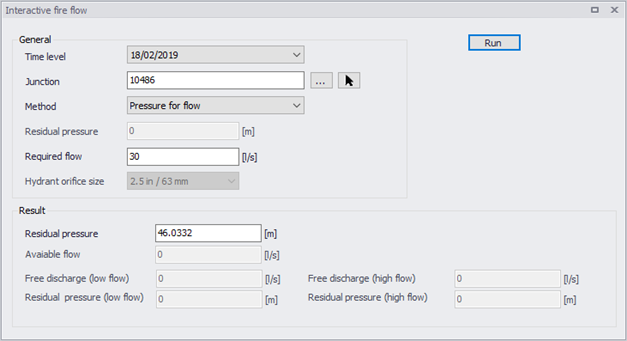
Figure: The Fire Flow window used in Interactive simulation
This 'Interactive fire flow' window offers the following attributes:
- Time level: This data entry is used to define the time (time level) when the fire flow will be simulated. If you select e.g. 9:00 AM, the program will run the standard hydraulic simulation from the beginning of the simulation to the time level corresponding to 9:00 AM and then the fire flow will be computed.
- Junction: This data entry defines the node used for the fire flow simulation. It is possible to select the node from the list of all junction nodes by selecting “…” button or click the node in the Map by using the “arrow” button.
- Method: Three methods are available:
- Pressure for flow: specify a design fire flow rate and compute the corresponding available fire flow pressure.
- Flow for pressure: specify a design fire flow pressure and compute the corresponding available fire flow rate.
- Free discharge hydrant: compute both hydrant discharge and residual pressure for a free discharge hydrant.
- Residual pressure: This data entry allows you to define the required design pressure that will be used in the calculation when you select the method “Flow for pressure”.
- Required flow: This data entry allows you to define the required design flow that will be used in the calculation when you select the method “Pressure for flow”.
- Hydrant orifice size: This is used to select the size of the hydrant orifice, among the two available sizes:
- 2.5 in / 63 mm
- 4.5 in / 115 mm
- Run: This button computes the fire flow results according to the selected method. For the 'Free discharge hydrant' method, the program runs the fire flow simulation and displays the hydrant discharge and residual pressure. The program is using experimental data to estimate the hydrant discharge coefficient based on the hydrant orifice size and it provides low and high hydrant discharge values rather than one exact value. The computed flow corresponds to the "free flow" from the hydrant orifice without pumping.
General
The 'General' tab offers the following attributes:
- Time start: This data entry Is used to define the time (time level) when the fire flow will be simulated. If you select e.g. 9:00 AM, the program will run the standard hydraulic simulation from the beginning of the simulation to the time level corresponding to 9:00 AM and then the fire flow will be computed.
- Use external hydrants data: This data entry is used to define an external file with fire hydrants and use them in the simulation instead of selecting model nodes.
- Hydrant layer: This data entry allows you to select a shapefile with fire hydrants. The program will use these hydrants for the fire simulation and it will find the nearest node in the hydraulic model, run the simulation, and write the results into the hydrant layer fields.
- Input field: This data entry allows you to specify a field from the hydrant layer where the program will write the input value (required pressure or required flow) for which the simulation was done.
- Results field: This data entry allows you to specify a field from the hydrant layer where the program will write the computed value (residual pressure or available flow).
- Selection: When external hydrant data are not used, this radio button selection allows you to define whether the fire flow analysis is performed for the selected junction nodes, for junction nodes within the selected selection list, or for all junction nodes. Use the next data entry to specify a selection list with junction node. Note, that the selection list can be defined using “Selection Manager” from the Map ribbon menu. When external hydrant data are used, this radio button selection allows you to define whether the fire flow analysis is performed for selected hydrants only (from the layer with reference shapefile) or for all hydrants in the reference shapefile. A Snapping tolerance defines the spatial tolerance that will be used to find the node in the hydraulic model that is the nearest junction node to the hydrant.
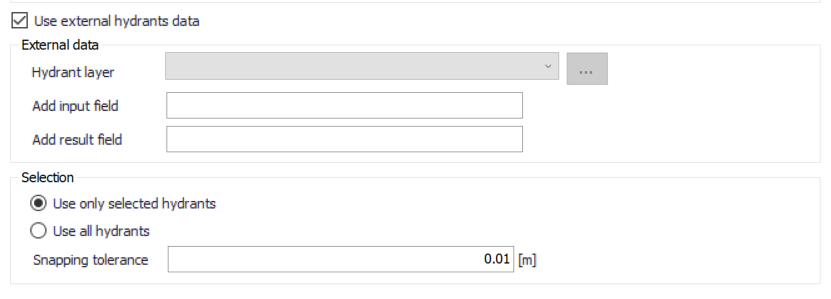
Figure: The Fire flow analysis editor using external hydrants data
Methods
From this 'Methods' tab, it is possible to run the analysis in automatic mode for a number of selected nodes.
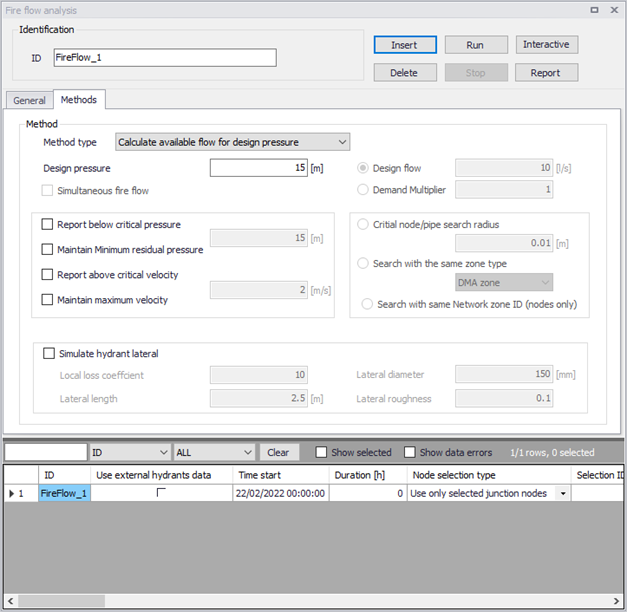
Figure: The 'Methods' tab from the 'Fire flow analysis' editor
- Method type: It is possible to specify a design fire flow rate and compute the available fire flow pressure or to specify a design fire flow pressure and compute the available fire flow rate. In addition to this, it is also possible to calculate the Q-H curve for the selected junction node. This selection allows you to select the fire flow analysis type:
- Calculate available flow for design pressure
- Calculate available pressure for design flow
- Calculate Q-H curve
- Design fire pressure: This data entry is used to define the design (required) residual fire pressure for which the available fire flow will be calculated.
- Design fire flow: This data entry is used to define the design (required) fire flow for which the available (residual) fire pressure will be calculated. Note, that this design fire flow is added to the existing node demand(s). In other words, if the design fire flow is 6 l/s and the node has e.g. a residential category demand of 0.25 l/s, the total flow (demand) out of the node during the fire flow analysis will be 6 + 0.25 = 6.25 l/s.
- Demand multiplier: This data entry allows you to specify the node demand multiplier which will be used to define the required fire flow by multiplying the node demand that is defined for the respective node in the Multiple demand editor.
- Simultaneous fire flow: This data entry allows you to run the fire flow simulation (Calculate available pressure for design flow mode) simultaneously i.e. all selected nodes flowing at the same time. If this option is not activated, the fire flow simulation is executed for all selected nodes in a sequential manner, i.e. one node at the time. A typical use of this option would be to run the fire flow simulation for simultaneously for 3 selected nodes.
- Report below critical pressure: This data entry allows you to report nodes, where the minimum residual pressure during the fire flow simulation is less than the critical pressure. The critical node pressure is entered into the field next to it.
- Maintain minimum residual pressure: This data entry allows the program to make corrections to the computed fire flow and reduce the amount of available flow in order to maintain the minimum residual pressure in critical nodes.
- Report above critical velocity: This data entry allows you to report pipes, where the maximum velocity during the fire flow simulation is greater than the critical velocity. The critical pipe velocity is entered into the field next to it.
- Maintain maximum velocity: This data entry allows the program to make corrections to the computed fire flow and reduce the amount of available flow in order to maintain the maximum velocity in critical pipes.
- Critical node/pipe search radius: This data entry allows you to define the search node and pipe radius, which will be used to identify nodes where the computed residual pressure is less than a critical pressure or pipes, where the computed velocity is bigger than a critical pipe velocity.
- Search within the same zone type: This data entry allows you to define that the search for the nodes and pipes should happen within the same pressure zone, where the zone is defined by a selection. In this case, you do not need to define the search radius and the program will search for all nodes or pipes within the same zone. Note, that this search option provides more accurate results than search based on the radius.
- Search within the same Network zone ID (nodes only): This option allows you to define that the search for the nodes should happen within the same pressure zone, where the zone is defined by the network properties (using the Zone ID specified in junctions, tanks and air-chambers). In this case, you do not need to define the search radius and the program will search for all nodes within the same zone. Note, that this search option provides more accurate results than search based on the radius.
- Simulate hydrant lateral: This data entry allows you to model a fire hydrant lateral (connecting) pipe at the junction node. Note that the fire flow results may significantly change with or without such pipe.
- Local loss coefficient: This data entry allows you to define a local loss coefficient (sum of) representing all local losses at the fire hydrant lateral pipe. A typical value is 6-10.
- Lateral diameter: This data entry allows you to define a diameter of the fire hydrant lateral pipe.
- Lateral length: This data entry allows you to define a length of the fire hydrant lateral pipe.
- Lateral roughness: This data entry allows you to define a roughness coefficient of the fire hydrant lateral pipe.
Running simulations
Click the 'Run' button to run the fire flow simulation. The program will run the fire flow simulation and the simulation progress will be displayed in the status panel where the currently executed node and results are visible. The .csv result file with the fire flow results is created during the fire flow simulation and can be used to browse the results outside of MIKE+ or it can be loaded into MIKE+ for results processing. The program also creates a Log file that contains additional details from the fire flow simulation. The simulation can be interrupted (cancelled) by pressing the Esc key.
Fire flow results
Results of the fire flow simulations can be displayed in different ways. Sections below describe how to display these results in tables or on a map. Besides this, the program also creates a *.log file in the project directory that contains additional details about the fire flow simulation.
Tabular results
The simulated fire flow results for all simulation modes are written into the output .csv file. The .csv file is a comma separated text file in a format that is suited for opening into Microsoft Excel, for example. The tabular results can be displayed in MIKE+ in result tables.
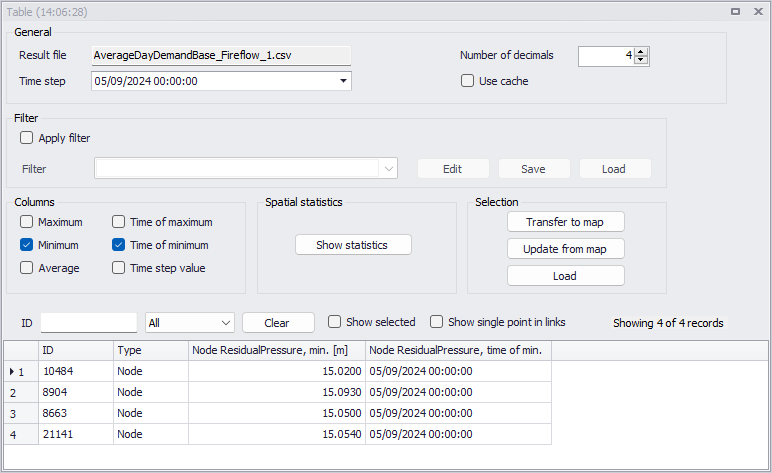
Figure: Example tabulated Fire flow analysis results
They can also be displayed directly from within the 'Fire flow analysis' editor by clicking the 'Report' button.
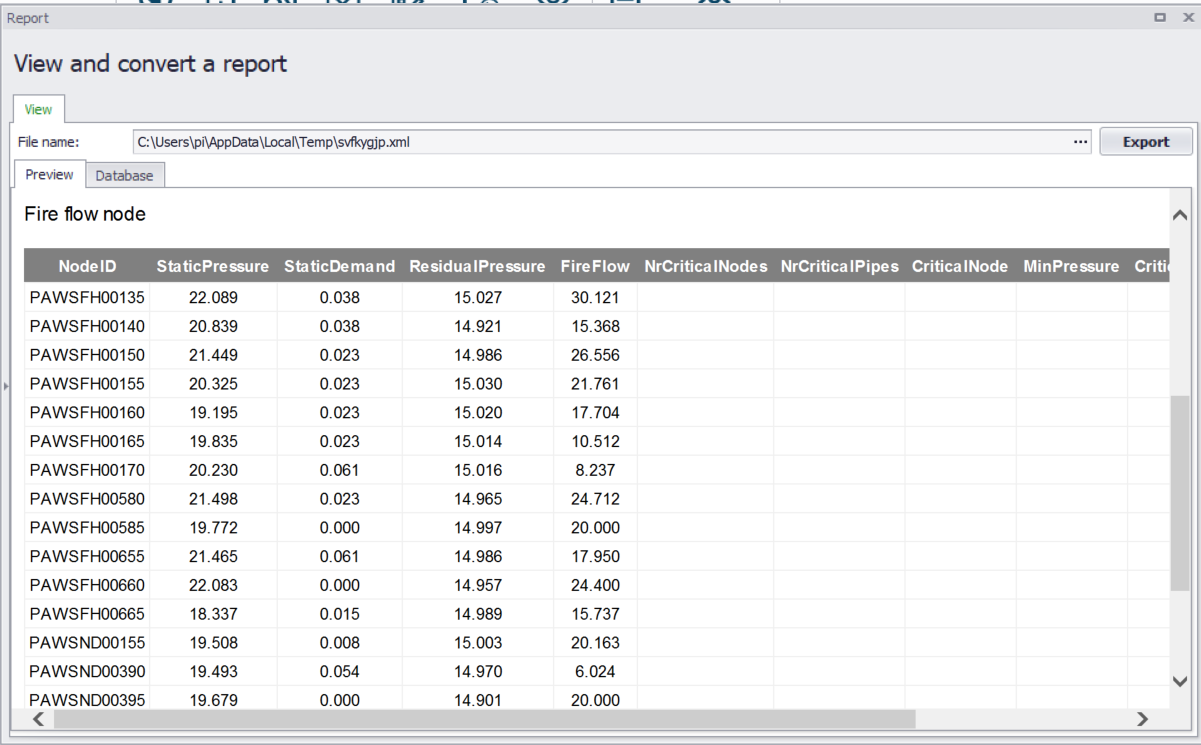
Figure: Fire flow results report
Thematic maps
The simulated fire flow results can be displayed using colour coded maps. Click the 'Add Layer' button from the 'Layers and symbols' tree and select one of the fire flow result items to create a colour coded map with the fire flow results.
List of available fire flow result items:
- Node static pressure: steady state pressure at the fire flow node
- Node static demand: steady state demand at the fire flow node
- Node residual pressure: simulated or given residual pressure during the fire flow simulation at the fire flow node
- Node fire flow: simulated or given fire flow at the node
- Number of critical nodes: the number n means at how many nodes the residual pressure was below the critical pressure
- Number of critical pipes: the number n means at how many pipes the velocity was above the critical velocity
- Critical node: node with the minimum residual pressure below the critical pressure
- Minimum pressure: minimum residual pressure reported for a critical node that is below the critical pressure
- Critical pipe: pipe with the maximum velocity above the critical velocity
- Maximum velocity: maximum velocity reported for a critical pipe that is above the critical velocity
- Status: error code:
- 0: No errors
- 1: Static pressure is already below the residual pressure, no flow available
- 2: Cannot find upper flow limit, no flow will be computed
- 3: Cannot iterate flow for pressure, no flow will be computed
- 4: No fire flow available at this residual pressure
- 5: Node does not exist, no flow will be computed
- 6: No flow available at this residual pressure and velocity
- 7: Residual pressure is negative for the required fire flow.
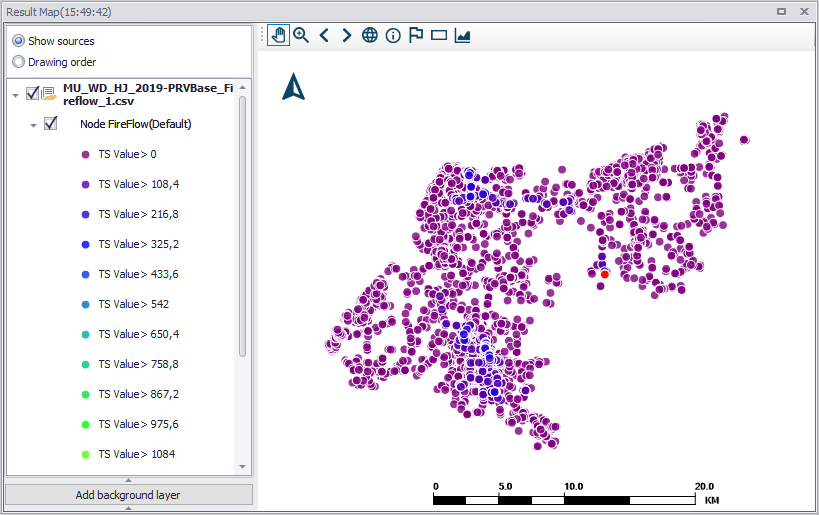
Figure: Example Fire flow analysis result map of Node fire flow
Q-H plots
When applying the method to compute a Q-H curve, the Fire flow analysis saves the relationship between the hydrant flow and the residual pressure in a .csv file. This table can be shown in a Q-H plot window. Refer to Hydrant Q-H Plot for more details.