Comparisons
A list of the Comparisons editor's attributes follows with a short description given for each one. Comparisons allow you to define pairs of matching entries: one for the measured data (SCADA) and another for the simulated data (hydraulic model). Comparisons can be the used for graphical visualization of differences in the Map or for alarming. Comparisons are also stored in the historical archive.
Insert
This button is used to insert a new row into the list.
Delete
This button is used to delete the selected row from the list.

Figure: The Comparisons editor for the Online analysis
The editor attributes are described below.
ID
This is the comparison ID.
Description
User-defined description of the entry.
Model type
The following outputs from the hydraulic model can be used for comparison with the telemetry (SCADA):
- Node pressure result
- Node Hydraulic Grade Line result
- Node demand result
- Node water quality result
- Calculated tank inflow/outflow result
- Link flow result
- Pipe velocity result
- Pipe headloss result
- Pipe water quality result
- Pipe status result (1 = temporarily closed, 2 = closed, 3 = open)
- Pipe setting result
- Pump status result (0 = closed (max. head exceeded), 1 = temporarily closed, 2 = closed, 3 = open, 5 = open (max. flow exceeded))
- Pump setting result
- Valve status result (1 = temporarily closed, 2 = closed, 3 = open, 4 = active (partially open), 7 = open (pressure setting not met))
- Valve setting result
- Calculated network zone demand
- Calculated tank flow for the network zone.
Model ID
This is the ID (MUID) of the hydraulic model element (node or link).
Model multiplier
This entry is the multiplier "k" that will be used to multiply the model value before using it in the comparison. The model value = mode value * k + n.
Model offset
This entry is the offset "n" that will be added to the model value before using it in the comparison. The model value = model value * k + n.
Sensor ID
Name of the sensor with demand data to be used for prediction.
Sensor table
This is the name of the table containing SCADA data.
Sensor multiplier
This entry is the multiplier "k" that will be used to multiply the SCADA value before using it in the comparison. The SCADA value = SCADA value * k + n.
Sensor offset
This entry is the offset "n" that will be added to the SCADA value before using it in the comparison. The SCADA value = SCADA value * k + n.
Is active
This check box allows the user to toggle the Active status of the comparison on and off.
Min alarm
This alarm value is used as follows: if the absolute value of a difference between simulated and observed is bigger than the "value" low alarm is triggered (alarm value is set to 1).
Max alarm
This alarm value is as follows: if the absolute value of a difference between simulated and observed is bigger than the "value" high alarm is triggered (alarm value is set to 2).
Low alarm
This alarm value is used as follows: if the simulated value is below the "value" low alarm is triggered (alarm value is set to 1)
Alarm low-low
This alarm value is used as follows: if the simulated value is below the "value" high alarm is triggered (alarm value is set to 2)
High alarm
This alarm value is used as follows: if the simulated value is above the "value" low alarm is triggered (alarm value is set to 1)
Alarm high-high
This alarm value is used as follows: if the simulated value is above the "value" high alarm is triggered (alarm value is set to 2)
Example
This configuration will define a comparison between the simulated node pressure at the node "P_10" and the measured data with the telemetry (SCADA) tag "AI_10001" in the table "AI". The simulated pressure in "m" will be converted into "bar" for the comparison. Alarms will be generated as follows: low alarm pressure \< 1 bar, low-low alarm pressure \< 0.5 bar, high alarm pressure > 7 bar and high-high alarm pressure > 8 bar.
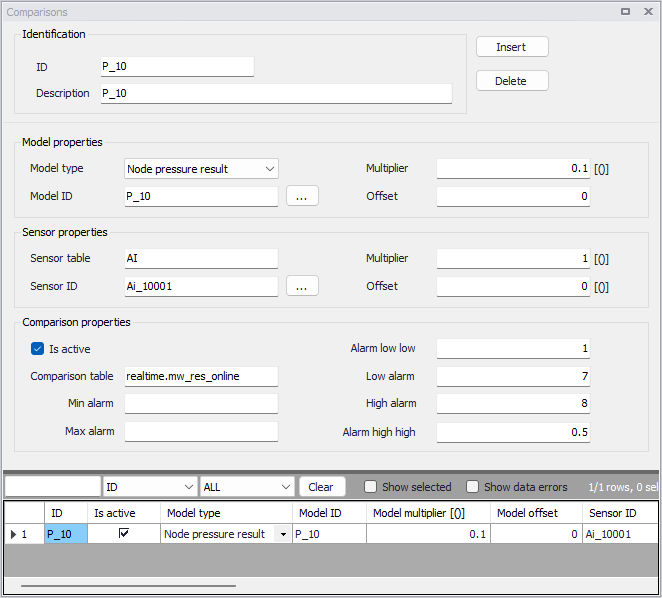
Figure: Example - Comparisons data input