Sustainability Analysis
Sustainability Analysis is not a simulation but a way of reporting results in a way that will help the user understand possible problems in the model.
The tool helps understand WD simulation results and analyze them for possible problems, anomalies, critical areas, and similar. Various predefined thematic maps are available including:
- Unit headloss to determine pipe size problems
- Reverse flows to identify possible water quality issues
- Service pressures
- Pressure, velocity, and other anomalies.
Sustainability Analysis Dialog

The Sustainability Analysis tool can be opened from the ‘WD analyses’ tools from the ‘Results’ tab of the ribbon.
The following settings need to be specified:
-
Result file: Result file name
-
Flow threshold: Minimum flow criteria used for reverse flow calculation.
-
Map layers: Select what layers will be added to the Map
- Service pressure
- Unit headloss
- Pipe flow
-
Report: Select sections included for reporting
- Storage tanks
- Pumps
- Unit headloss
- Service pressure
- Pipe flow
- Report each time level (pipes and nodes): Please note that selecting each time level can result in excessive processing time.
The following buttons are also available:
- Create: Perform the sustainability analysis
- Report: Create a report.
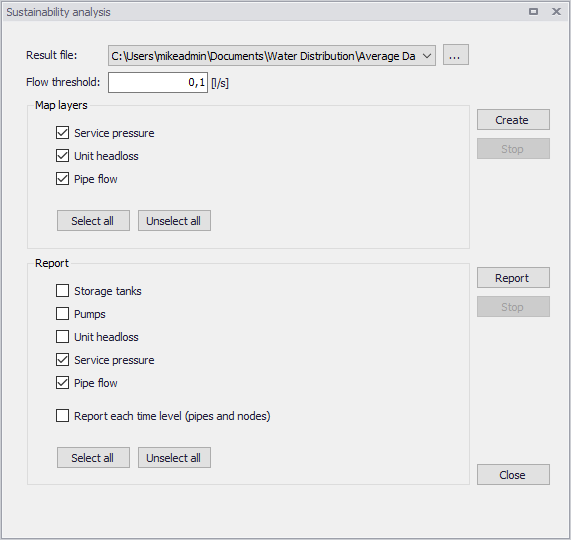
Figure: The Sustainability Analysis dialog
Map Results
Results from running the tool are added to the Map.
The tool provides a detailed analysis of the simulation results, and it will create the following layers. The symbology of each layer is predefined, but may be changed via the Symbology Settings editor from the Layers and Symbols panel.
- Unit head loss: Link head loss per 1000
- Service pressures
- Pressure anomalies e.g. pressure too low or too high
- Pressure range: Pressure distribution
- Pressure fluctuation: Difference between the minimum and maximum pressure at every node during the simulation.
- Pipe flows
- Reverse flow: The layer will show how many times the flow direction has changed in every pipe. Note that a threshold value needs to be specified e.g. "0.1" , meaning that if the absolute flow is smaller than that, the pipe is not considered for reporting, i.e. the flow must be smaller than -0.1 and greater than 0.1 to be considered as a pipe with flow.
- Flow velocity: Velocity distribution
- Flow velocity fluctuation
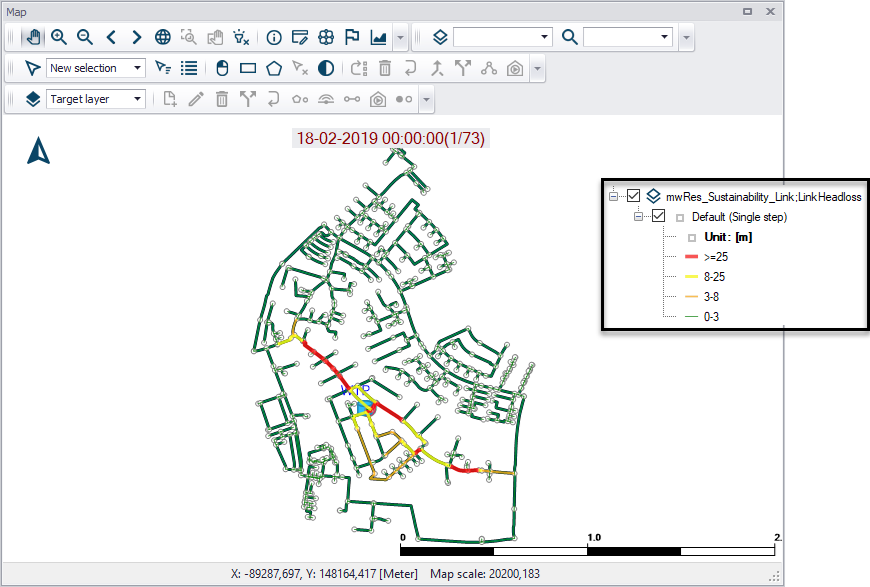
Figure: Example Sustainability Analysis Unit Head Loss results on the Map
Reports
In addition to the Map layers, detailed reports can be generated to understand the operation of pumps, storage tanks, and other facilities (figure below). Click on the ‘Report’ button in the Sustainability Analysis tool to generate a report.
The Sustainability Analysis report uses a pre-set template and may contain the following information:
- Storage tanks: Reports tanks that are either drained or overflows during the simulation.
- Reports if the tanks are balanced within the simulation. Balanced tank is a tank where the water level at the beginning of the simulation is the same as at the end of the simulation.
- Pumps: Reports pump that are operated near their maximum capacity
- Unit Headloss: Reports pipes with too high unit head loss
- Service Pressures: Reports excessive pressures
- Pipe flows: Reports reverse flows
- Flow velocity: Reports excessive flow velocity.
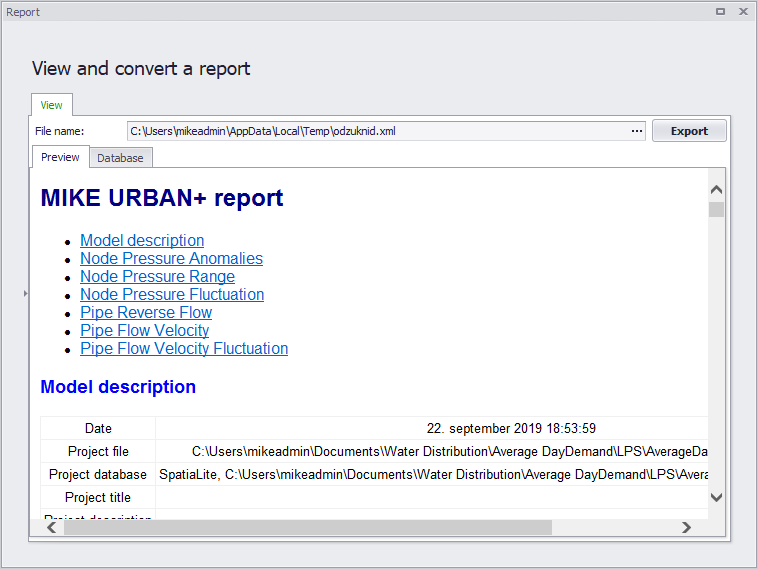
Figure: Example Sustainability Analysis Report