Displaying Results on a Map
Simulation results map be plotted on:
- Result Map: A map result document.
- Map View: The main Map view with the model layers.
Result Map
To create a new result map, right-click on the result file or one of its result items in the list of result files, or use the 'Create result map' button in the ribbon.
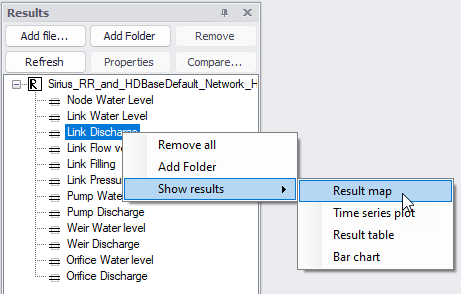
Figure: Creating a result map from list of result files
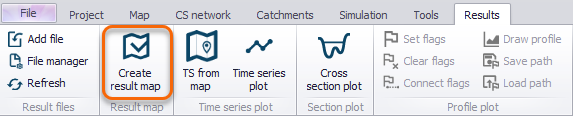
Figure: ‘Create result map’ option on the Results ribbon
Both options will open the ‘Create result map’ window below.
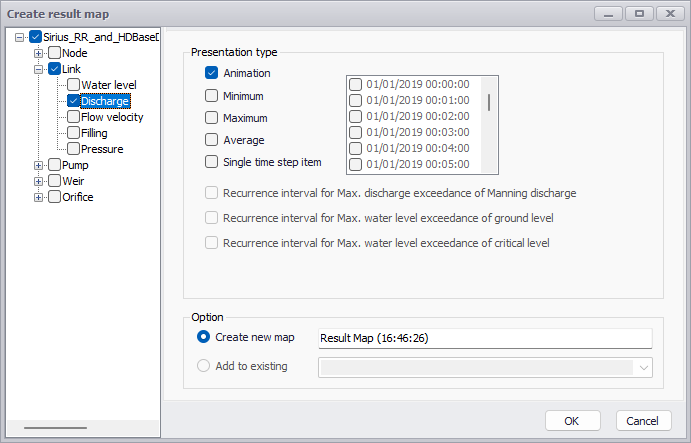
Figure: Choosing plot value type to display on the map
To create the result map:
- Choose among the data types to display on the map (e.g. water level in nodes, discharge in links, etc.) by ticking on the check boxes. The available data types are dependent on the result file and loaded result items.
- Select the presentation type:
- Animation. Time-varying results.
- Minimum. Minimum value statistics. Not available for 2D result files.
- Maximum. Maximum value statistics. Not available for 2D result files.
- Average. Mean value statistics. Not available for 2D result files.
- Single time step. Option for plotting results at a particular time step. Select the date/time period from the input box on the right.
- Single recurrence interval. For LTS extreme results. The left list contains computed recurrence intervals saved in the result file, whereas the right list allows specifying custom recurrence intervals for which the results are interpolated using a linear interpolation method from the recurrence intervals in the result file.
- Recurrence interval for max. discharge exceedance of Manning discharge. For LTS results. Manning discharge refers to full-flowing discharge.
- Recurrence interval for max. water level exceedance of ground level. For LTS results.
- Recurrence interval for max. water level exceedance of critical level. For LTS results.
- Select between the two options:
- Create new map: the new result layer will be shown in a new window, named with the specified title.
- Add to existing: the new result layer will be shown in the selected existing result window.
- Click the ‘OK’ button to create the map.
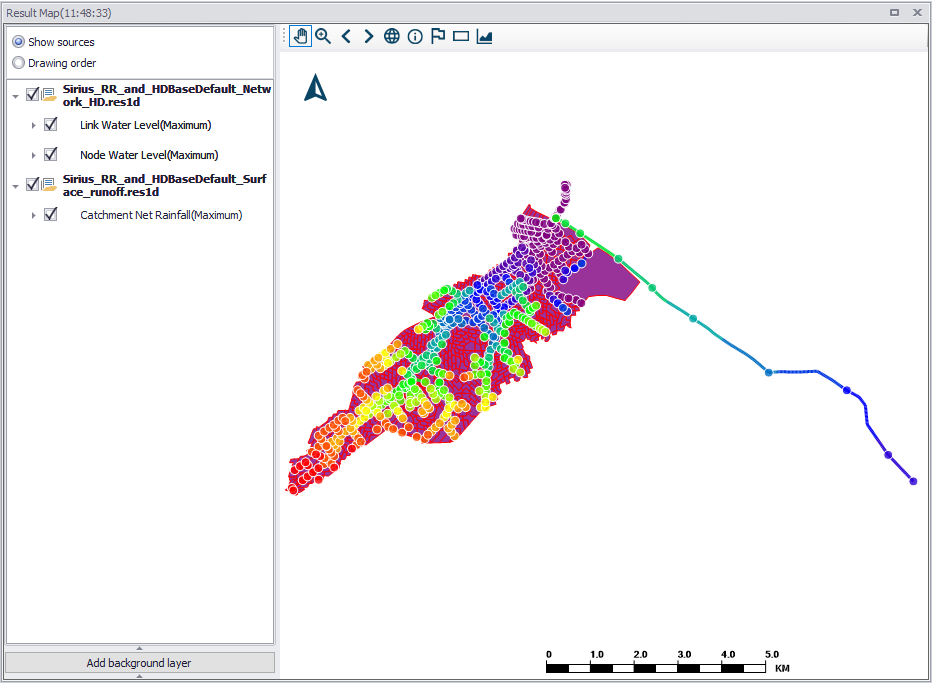
Figure: Example Map plot of rainfall, and node and link water levels
The toolbar at the top of the map contains various tools, amongst which:
- Various tools to pan or zoom, to navigate on the map
- Identify: shows the properties and the result values of a network item in the property view of the result map, after selecting the item on the map.
- Add result items: opens a result selection window, to add extra result layers on the map.
- Flags and profile plots: adds flags on the result map to display a profile plot view along the network.
- Add time series from map: opens the 'TS from map' tool, to show time series from locations selected on the map. See ‘Time Series Plot’ chapter for more information.
- Save to plots manager: saves the result map (with its list of result items) to the 'Plots' panel. The result map will initially be added to the active folder from this panel. See Plots Management chapter for more information on options to save and manage results windows.
Map View
It is also possible to directly visualize result items on the model Map (i.e. Map View).
Automatic loading of results into the project also loads several pre-selected result items into the Layers and Symbols tree view for visualizing on the main Map (figure below). When manually loading simulation results into the project, result items may also be chosen to be shown on the model map. See “Loading Results” on page 414. These result items are then also included in the Layers and Symbols tree view panel for showing on the main Map view.
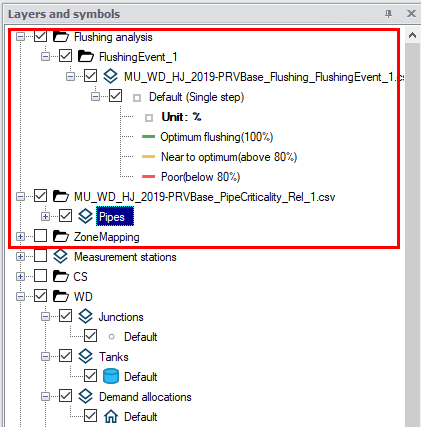
Figure: Example result items loaded into the Layers and Symbols tree view for showing on the main Map
Customization of the layer appearance is then performed via the Symbology Settings editor launched from the Layers and Symbols tree view by double clicking on a result item layer name.
Labelling and Symbology
To customize labelling and symbology of a result layer on the main Map view, edit the Symbology settings as for any other layer shown on the Map view.
To customize labelling and symbology on an extra result map layer:
- On the left panel of the result plot, right-click on the result item layer and choose ‘Show property panel’ from the local context menu. The property panel appears at the bottom left corner of the window (Figure 20.14).
- Click the ‘Edit style’ button in this property panel (Figure 20.14).
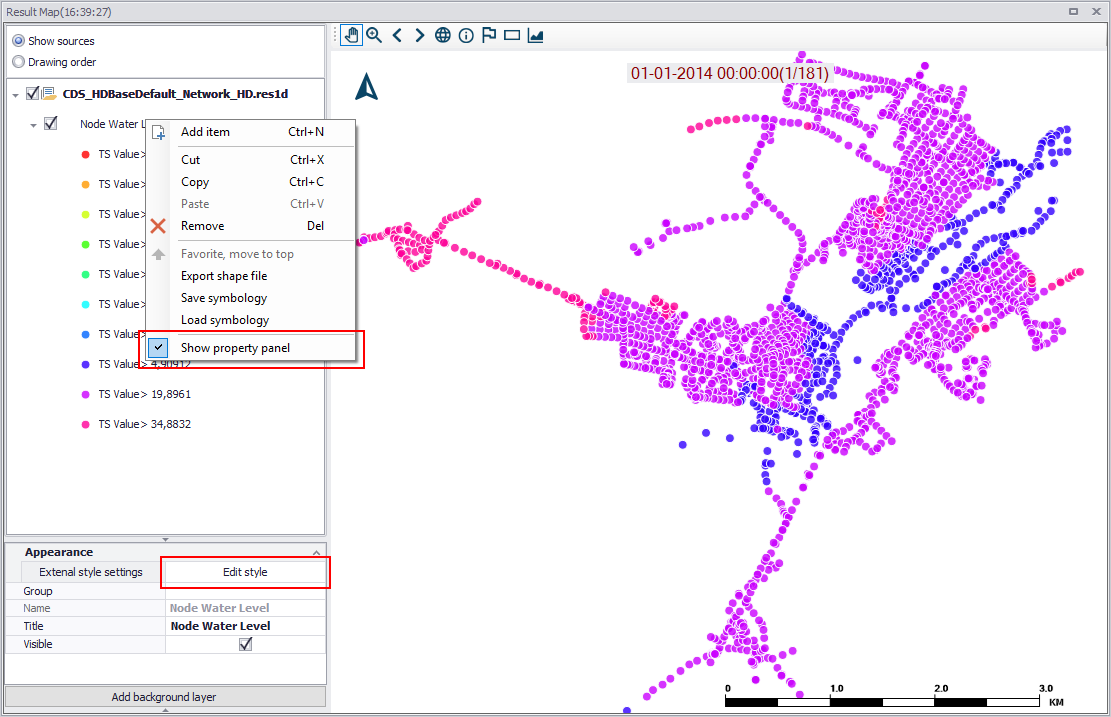
Figure: Edit a result layer symbology and label via the ‘Edit style’ button
This will open the Symbology settings editor.
Flow Arrows
An option for showing direction arrows for line result layers is available in the Symbol tab.
Activate the ‘Draw direction arrow’ to display flow arrows along line features. Define arrow placement along features.
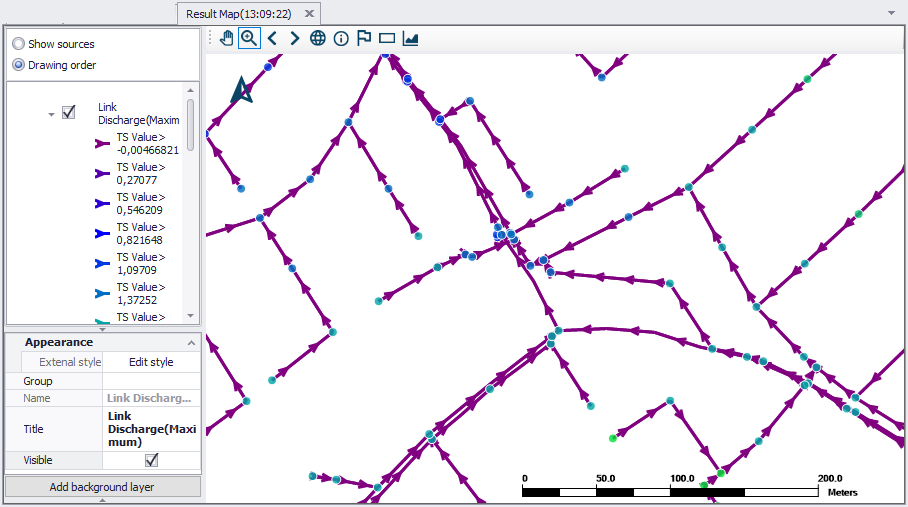
Figure: Example plot of link discharge results showing flow arrows
Save Symbology
It is possible to save the symbology and label settings for a result layer into a file, which may then be loaded and used for another result layer.
Right-click on a result layer and select “Save symbology” from the local context menu.
“Load symbology” allows loading a previously saved configuration file.
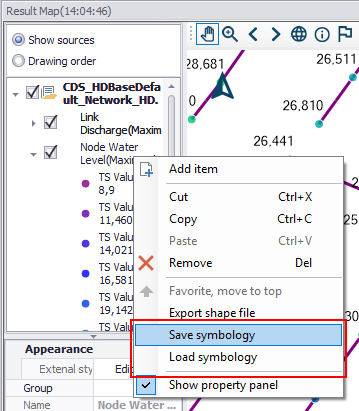
Figure: Options for saving or loading symbology settings from the left panel local context menu