Catchment Delineation Tool
The catchment delineation tool helps delineate catchment polygons in an automated and reproducible way. The catchments can be automatically created as Thiessen polygons derived from a layer of points or lines or as polygons derived from a digital elevation model (DEM).
The tool guides you through the steps of the delineation process (figure below).
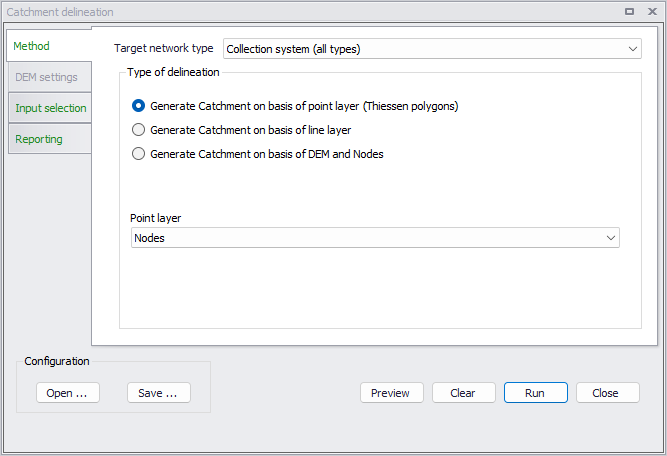
Figure: The catchment delineation tool
Method
The first step in the delineation process is to select the type of delineation.
For model setups with model type 'Rivers, collection system and overland flows', a target network type can also be selected. For collection system the 'Target network type' can act as a filter, to select which items on the network may be used to delineate catchments. Therefore, the CS network type must be appropriately set for the network items, before applying a specific target type.
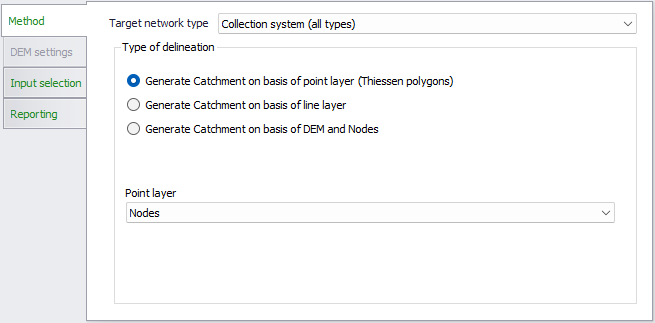
Figure: Selection of the type of delineation to use with a collection system
When delineating catchments for a collection system network, the three options available are:
- Generate catchment on basis of point layer (Thiessen polygons). Based on Voronoi partitioning, which is a mathematical way of diving spaces into a number of regions.
- Generate catchment on basis of line layer. Also based on Voronoi partitioning principles, but around line segments instead of points.
- Generate catchment on basis of DEM and nodes. The catchments will describe the actual hydrological catchments around inlet nodes, defined based on the slopes on the DEM. This option requires pre-loading a valid DEM layer in the project. A valid DEM must be in *.asc or *.dfs2 file format.
Depending on the delineation type, select the actual layer upon which the delineation shall be based. Available layers relevant to a delineation type are offered in the drop-down menu.
When the catchments are created as Thiessen polygons (or Voronoi cells) you start out by specifying a selection of points or lines to use as an input layer. Typically either all manholes or all links, or only a selection.
The tool will proportionally divide and distribute a point coverage into the polygons known as Thiessen polygons. When a line layer is used as input, the points used are the midpoints of the lines. Each polygon contains only one input feature point. Each polygon has the unique property that any location within the polygon is closer to the polygon's point than to the point of any other polygon.
The Thiessen polygons (or Voronoi cells) are constructed as follows:
- All points are triangulated into a triangulated irregular network (TIN) that meets the Delaunay criterion.
- The perpendicular bisectors for each triangle edge are generated, forming the edges of the Thiessen polygons. The location at which the bisectors intersect determine the locations of the Thiessen polygon vertices.
The outside boundary of the Thiessen polygons needs to be specified. Either as a user specified polygon (created on the fly or loaded in as a layer) or as extent of the points used plus an additional area.
Note
The underlying Delaunay triangulation method used works best with data in a projected coordinate system.
Note
When working with point layers, outlet nodes are always excluded from the analysis (no catchment delineated around outlets).
When delineating catchments for a river network (only available for model type 'Rivers, collection system and overland flows'), the delineation is always based on the slopes from a DEM. This requires pre-loading a valid DEM layer, in *.asc or *.dfs2 file format, in the project. Three options are available to define the location of delineated catchments:
- Automatically delineate catchments at confluences. This method attempts to split the overall catchment according to the modelled river network, by creating one catchment at each upstream end of the river network and at each confluence between two rivers. At these confluences, the tool will create one catchment for each of the rivers: if the tributary river ends exactly on the main river, then the starting point of the two catchments will have the same location on the DEM, and the tool would delineate the same catchment for the two rivers. To address this issue, the starting point of the catchments is moved upstream by a minimum distance from the confluence. A small value for this minimum distance is recommended, so that the delineated catchment remains close to the confluence. After previewing the delineated catchments, if the tool fails to create different catchments for the two rivers, then this value should be increased.
- Manually locate on map the catchment's connection to the river. This method lets the user identify on the river network (clicking on the map) where catchments should be created.
- Automatically generate catchments on basis of point layer. This method uses a point layer to define the location of the start points of the catchments. When this option is selected, a point layer must be chosen, and a search radius must also be specified. The tool will delineate a catchment for each point in the source layer, and will create a catchment connection to the closest river location (or storage) from each point. If no river or storage is found in the search radius, no catchment connection will be created.
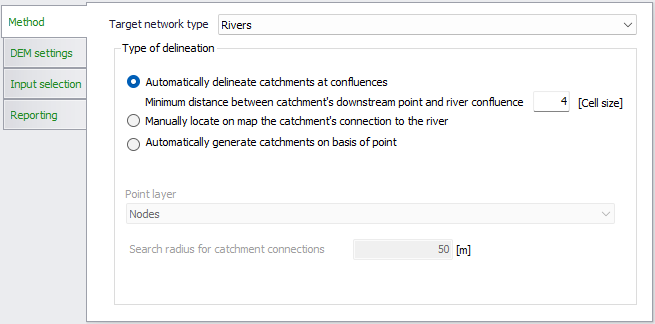
Figure: Selection of the type of delineation to use with a river network
DEM settings
When the delineation is based on a DEM, the DEM source layer must be selected from the 'DEM settings' tab. The DEM must be added to the map prior to the delineation, and the drop-down list will show all valid DEM files.
The additional controls below are available.
Spatial extent
Two options are available:
- Use whole DEM: the entire extent of the DEM will be included in the analysis.
- Use DEM only inside digitized area: this option allows defining a reduced extent covered by the DEM, from the map. Click the 'Digitize' button to draw on the map a rectangle defining the reduced extent. Once the area is finally defined, right-click on the map to stop the digitization. To edit the reduced area afterwards, use the 'Edit' button and then click and drag the symbols on the map to resize the rectangular area or move it on the map. Right-click on the map to stop editing.
Resampling
Resampling requires specification of a resampling factor. If a resampling factor of 2 is used, then the minimum elevation of a 2x2 set of pixels is assigned to one new pixel with the same area as the 2x2 set. A resampling factor of 3 assigns the minimum value of a 3x3 pixel set to one new pixel with the same area as the 3x3 set, and so on.
Number of pixels
This group shows for information the number of pixels in the source DEM, as well as the final number of pixels actually used in the analysis. They are both provided as number along the X axis and along the Y axis respectively. The final number of pixels is reduced by the spatial extent of the analysis when using the option 'Use DEM only inside digitized area', and is divided by the value of the resampling factor.
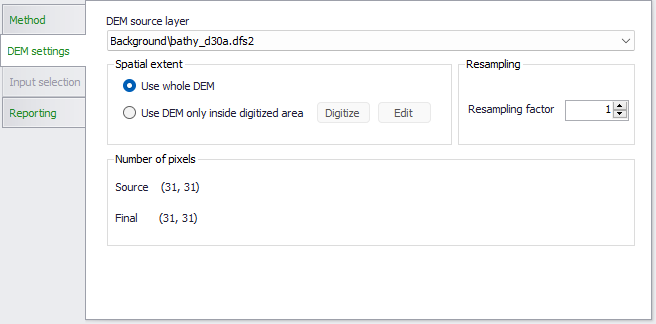
Figure: Controlling the DEM settings for the catchment delineation
Input selection
Next step is selection of the extent for the delineation, see figure below.
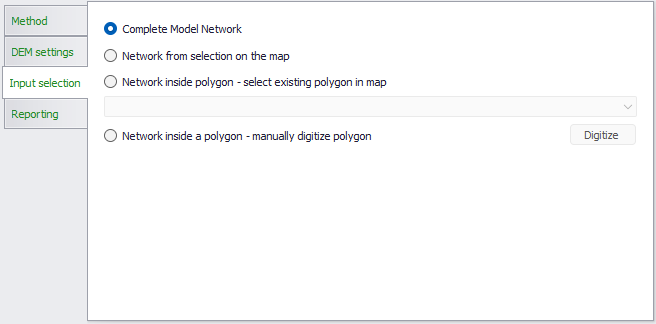
Figure: Selection of the part of the network to be processed
There are four options:
- Complete model network. Uses a default boundary defined by a rectangle covering the complete network (including a 30-m buffer zone). There is no additional setting for this option. A catchment will be delineated around each network element (node, pipe or river).
- Network from selection on the map. Creates a catchment around each network element currently selected on the map. When delineating catchments for river networks with the method 'Automatically delineate catchments at confluences', catchments are only created at confluences between two selected rivers.
- Network inside polygon - select existing polygon on map. Select an existing polygon from a polygon layer added to the project. If this method is selected, the specific layer to be used is chosen from the dropdown list and the specific feature selected on the map. A catchment will be delineated around each network element within this polygon. After selecting the polygon layer from the list, the message "Please select a feature" will appear: select polygon(s) from the layer to be included by clicking on the map.
- Network inside polygon - manually digitize polygon. Manually digitize the polygon on the map. If this method is selected, use the ‘Digitize’ button to draw the boundary directly on the map, ending the digitization with a double-click. A catchment will be delineated around each network element within this polygon.
Note
For DEM-based delineation, the delineation is performed according to the defined input selection, but catchments covering the total extent of the input DEM will still be generated.
Click on the ‘Run’ button to delineate the catchments according to the specified configuration.
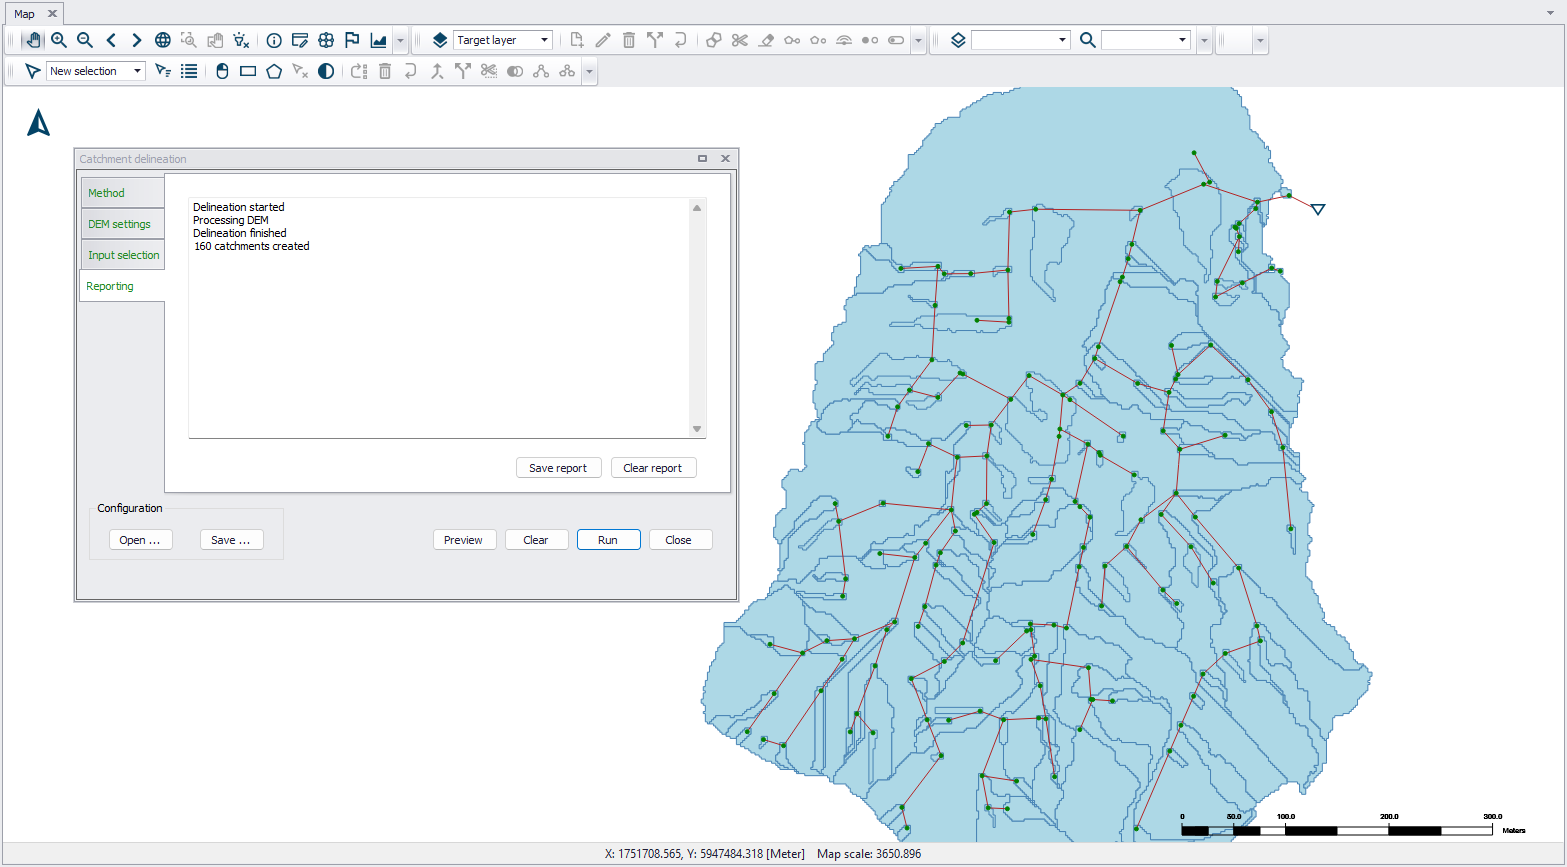
Figure: Click on the ‘Run’ button to perform catchment delineation
Reporting
This section displays a summary of results from running the delineation tool.
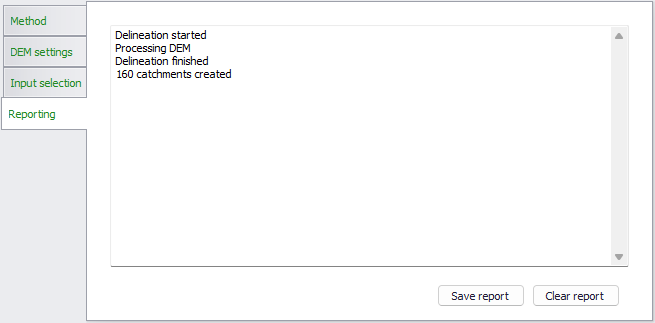
Figure: Report from the catchment delineation tool
If the reported information is relevant for future use, it can be saved to a text file using the 'Save report' button.
Buttons
The following buttons are available at the bottom of the tool.
‘Open...’ button
Loads a previously-saved catchment delineation *.XML configuration file.
‘Save...’ button
Saves the current catchment delineation configuration into an *.XML file.
‘Preview’ button
Option for viewing preliminary results of a catchment delineation configuration. . If not satisfying, the settings can be modified and the delineation can be previewed again. The previewed results are not saved to the model database until actually executing the tool.
‘Run’ button
Executes the catchment delineation tool following the defined configuration.
‘Clear’ button
Resets the map view by removing highlights or preliminary delineation lines related to result previewing or extent digitization.