Create Hazard Maps Tool
Introduction
The purpose of the 'Create hazard map' tool is to derive hazard values from 2D result files, where hazard values are typically derived from water depth and current speed results. Various definitions of the hazard variable may be applied. It can also derive additional result items like Time to start, Time to peak or Duration, for various result items.
2D result files in both flexible mesh format (.dfsu file) and rectangular grid format (.dfs2 file) are supported.
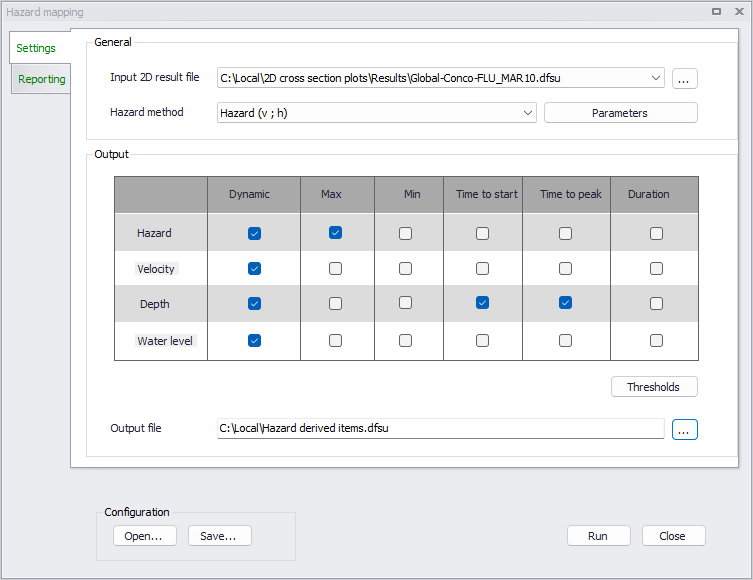
Figure: The Create hazard map tool
General settings
The input 2D result file is selected from the list of result files loaded in the MIKE+ project, or by selecting a new file with the '…' button. The selected file must at least contain the following result items:
- ‘Total water depth' or 'Surface elevation'
- and 'Current speed' or the combination of 'U velocity' and 'V velocity'.
The type of hazard calculation method is selected in the 'Hazard method' list. Four methods are available, and each of them uses user-defined settings specified using the 'Parameters' button. The available methods are:
- Hazard (v ; h)
- Hazard (v * h)
- UK Methods
- Italian method
Hazard (v ; h)
For each cell from the .dfs2 result file or element from the .dfsu result file, the tool reads the depth and the speed values and look up the corresponding hazard category (value) from the parameter table. In this table, the left column contains the input current speed values (in m/s or ft/s) and the top row contains the input water depth values (in meters or feet). Output hazard values are specified in the remaining cells of the table.
For this method, hazard is classified into categories, corresponding to given ranges of current speed and water depths. Values of current speed provided in the table (left column) and depth (top row) represent the lower limit of this range. For instance, for the example illustrated below, the hazard will be assigned the value 1 whenever the current speed will be between 0.2 and 0.5 m/s and the water depth between 0.5 and 1.0 m.
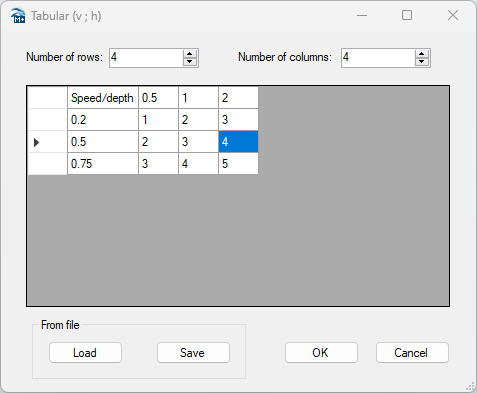
Figure: Example of parameter table for Hazard (v ; h) method
The 'Load' and 'Save' buttons may be used to save the content of the table in a text file, to be re-imported at a later stage.
Hazard (v * h)
For each cell from the .dfs2 result file or element from the .dfsu result file, the tool multiplies the depth and the speed values and look up the corresponding hazard category from the parameter table. In this table each column is a hazard category corresponding to a range of speed*depth values. Speed*depth values provided in the top row of the table represent the lower limit of this range.
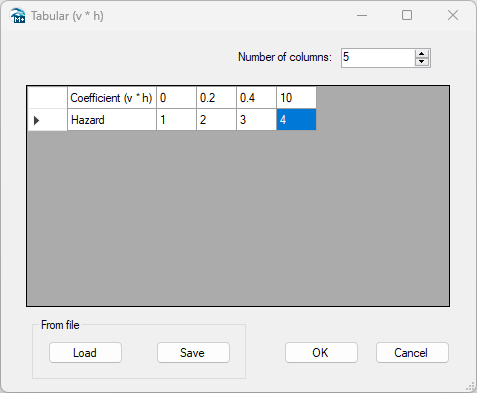
Figure: Example of parameter table for Hazard (v * h)
The 'Load' and 'Save' buttons may be used to save the content of the table in a text file, to be re-imported at a later stage.
UK Methods
Two UK methods are available, which both use a similar definition, simply differing in how a debris factor is estimated.
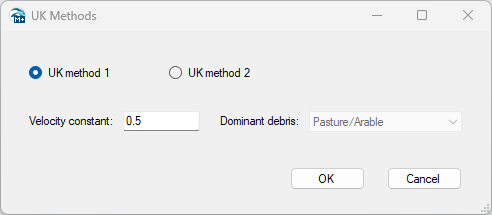
Figure: Example of input for UK Methods
With these methods, hazard is defined using the following formula:
(23.1) 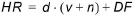
where:
HR: hazard rating
d: depth
v: current speed
n: a constant (typically = 0.5)
DF: debris factor
With UK method 1:
if d > 0.25 then DF = 1.0, otherwise DF = 0.5
With UK method 2:
DF = 0, 0.5 or 1, depending on water depth, current speed and dominant land use, with the relationship described in the table below.
| Depths (d) and speed (v) | Pasture/Arable | Woodland | Urban |
|---|---|---|---|
| d from 0 to 0.25 m | 0 | 0 | 0 |
| d from 0.25 to 0.75 m | 0 | 0.5 | 1 |
| d > 0.75 m and/or v > 2 | 0.5 | 1 | 1 |
Table: Guidance on debris factors for different flood depths, velocities and dominant land uses
Italian method
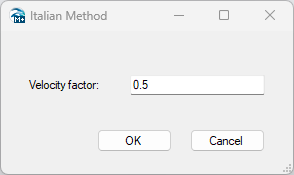
Figure: Example of input for Italian Method
With this method, hazard is defined using the following formula:
(23.2) 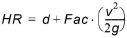
Where Fac is the velocity factor specified in the tool, which is typically 1, 0.5 or 0.25.
Output settings
Two output files may be generated when pressing the 'Run' button:
- One file containing static output items: Maximum, Minimum, Time to start, Time to peak and Duration. This file will be created if at least one of these items is ticked. The file is named with the file name specified in the 'Output file' field underneath the table.
- One file containing the dynamic output items, i.e. instantaneous values, if a Dynamic item is ticked. This file is named with the file name specified in the 'Output file' field, but with the suffix '_dynamic'.
Each file may contain several variables, which are selected in the table: hazard (as defined in the Hazard method), velocity, water depth and water level.
Thresholds
Output values are controlled by threshold values, specified from the 'Thresholds' button. The threshold values are used to filter noise.
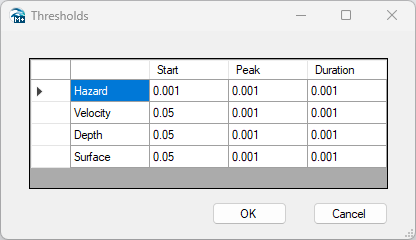
Figure: Example of threshold values
Thresholds values are only used when processing the variable they correspond to. Therefore, the calculation of hazard variable depends on hazard thresholds but not on velocity nor depth thresholds.
The Start, Peak and Duration thresholds are expressed in the same unit as the corresponding variable. The thresholds' units for hazard are expressed in hazard unit.
Maximum
The maximum value in a given cell is found by comparing the instantaneous values with the Peak threshold into account. Starting from the first value in this cell, the maximum value is updated with a new higher value from a following time step only if this new value is higher than the previous maximum value + the Peak threshold. If the values from the following time steps are higher but don't differ by more than the Peak threshold value, then the maximum value is not updated with these following values.
On the illustration below, if the difference between the value at location #1 and #3 is less than the Peak threshold, then the output maximum value is the value from location #1, which therefore slightly differs from the absolute maximum value. This may be useful in flooding applications, to catch the first value representative of the maximum, and therefore to also catch the corresponding time (see Time to peak below).
If the Peak threshold is reduced slightly, then the output maximum value will be value from location #2 and if the Peak threshold is reduced further, then the output maximum value will be the absolute maximum value from location #3.
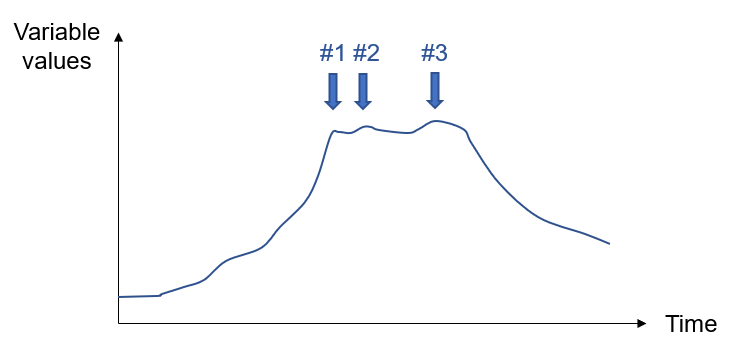
Figure: Example of captured maximum values depending on Peak threshold
Since the output maximum value may differ from the absolute maximum value, it is recommended to keep the Peak threshold relatively small. To ensure that the output maximum value is the absolute maximum value, the Peak threshold should be set to 0.
Minimum
The minimum value in a given cell is found with the same approach as for the maximum, but using instead the Start threshold. That is, the minimum value from previous time steps is updated with a new smaller value from a following time step only if this new value is smaller than the previous minimum value minus the Start threshold.
Since the output minimum value may differ from the absolute minimum value, it is recommended to keep the Start threshold relatively small. To ensure that the output minimum value is the absolute minimum value, the Start threshold should be set to 0.
Time to start
If the 2D cell is empty at the first time step, then the Time to start is the accumulated time spent before the cell is no longer empty. If the cell is not empty at the first time step, then the Time to start is the accumulated time until the variable's value differs from the value in the first time step by more than the Start threshold.
In the case where the cell does not change during the whole simulation (it remains empty, or it's not empty but its value does not change by more than the Start threshold), then the Time to start result is empty. In the special case where a non-empty cell keeps a constant value during the simulation period and where the Start threshold is set to 0, then the resulting Time to start is also 0.
The reported Time to start is expressed in hours.
Time to peak
The Time to peak is the accumulated time until the maximum value (as defined above, considering the Peak threshold) is reached.
The reported Time to peak is expressed in hours.
Duration
The Duration is the accumulated time while the variable's value is higher than the Duration threshold value.
The Duration thresholds are expressed in the same unit as the corresponding variable (for example, the Duration threshold for Depth is per default expressed in meters, etc.). The reported duration is expressed in hours.
Reporting
Once a hazard calculation is run, status and errors are reported in this tab of the tool. This report can be saved for further inspection at a later stage.
Configuration
Once the tool has been configured, it is possible to save its configuration to a file using the 'Save…' button for later re-use. This configuration can later be loaded again using the 'Open…' button, or can be used to execute the tool from a command line.
Running the tool from command lines
MIKE+ user interface is usually the preferred way to execute this tool. However, there are times when it may be more convenient to execute the tool in an automated way without opening it in the user interface.
The MIKE+ executables enable you to execute some tools without opening their editor, through command lines. It is possible to run the 'Create hazard map' tool in this manner, assuming you have prepared the configuration file beforehand in MIKE+.
Start by locating the MIKE+ executable named DHI.MIKEPlus.ToolShell.exe in the installation folder. From a command prompt, type the command below to access the list of supported tools, replacing the … characters by the actual path to the file:
The format of the command for running the 'Create hazard map' tool is:
Where [Configuration file] is the path to the *.xml configuration file.