Results Table
The results table provides an overview of all or selected results in tabular form. This is only available for 1D network results.
To create a new result table, right-click on the result file or one of its result items in the list of result files, or use the 'Results table' button in the ribbon.
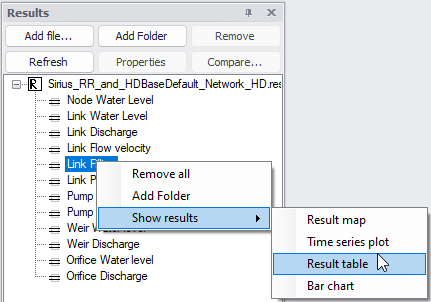
Figure: Creating a result table from the list of result files
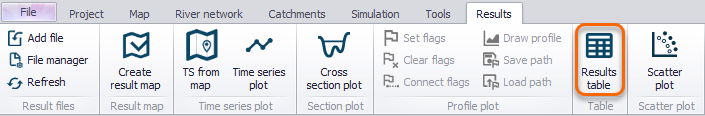
Figure: 'Results table' option on the Results ribbon
Both options will open the 'Create result table' window below.
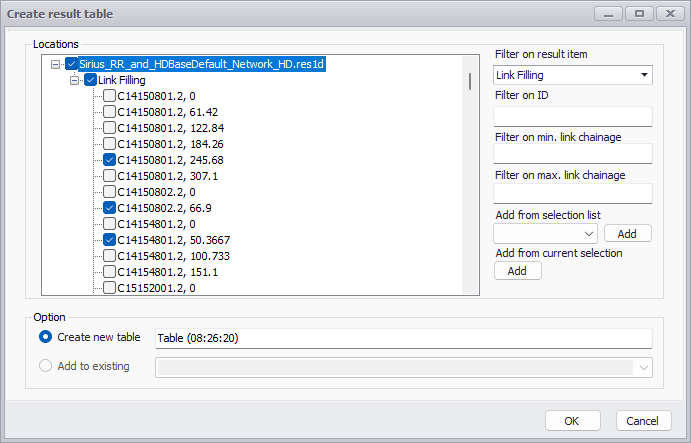
Figure: The ‘Create result table’ window
Choose the result file, result item and locations to plot from the list. Use the filters to search through the potentially long list of available locations, to filter on item type, ID and/or chainages (chainage filtering being available only for link results from .res1d result files). One may also use a selection list (saved in the 'Selection manager') or the active selection, to select all items from the selected list.
Select between the two options:
- 'Create new table': the new result data will be shown in a new window, named with the specified title.
- 'Add to existing' options: the new result data will be shown in the selected existing result table.
Then click on the 'OK' button to create the table. This will open the results table in a new window.
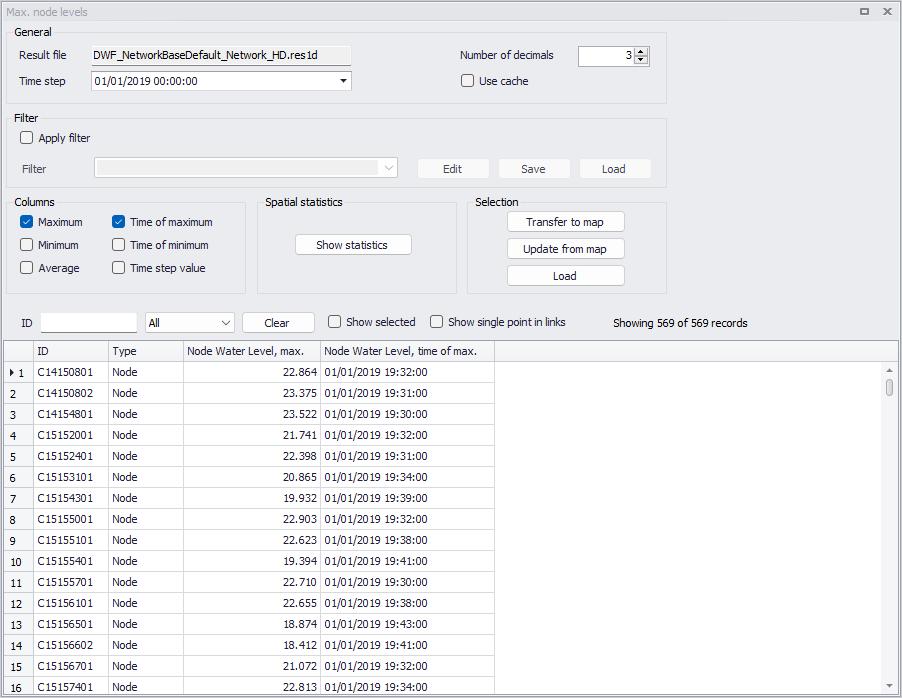
Figure: The Results table window
General
The 'General' group at the top shows the following items:
- Result file: the name of the result file, shown for information only (non editable).
- Time step: the date and time of the result time step. This is only relevant for result columns showing instantaneous results (when the 'Time step value' column is included).
- Number of decimals: controls the number of decimals to be shown in the table.
- Use cache: when this option is selected, displaying the table may be faster but will also use more memory on the computer.
Filter
The filter can be used to reduce the number of records shown in the table, using any type of filter criteria (e.g. based on item ID, item type, result value).
When 'Apply filter' is active, it is possible to create a new filter or edit the current one, using the 'Edit' button. Alternatively, it is possible to change to a previous filter, from the drop-down list showing all previous filters. This list of previously-applied filters can be saved to an external file using the 'Save' button, in order to be loaded later in other tables using the 'Load' button.
Clicking 'Edit' will open the filter editor. The 'Text' tab shows the filter's expression which can be manually edited. The 'Visual' tab offers an easy way to edit the filter. Add new criteria by clicking the '+' button, and click the various components to edit e.g. the column to be filtered or its filtered value.
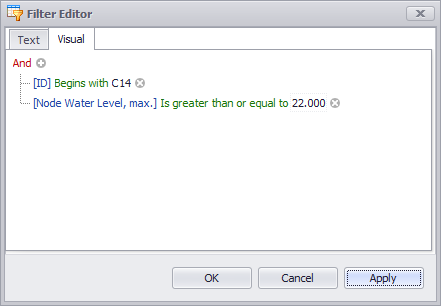
Figure: The filter editor
Columns
Select here which columns should be displayed in the table:
- Maximum: the maximum value during the simulation period, for each calculation point.
- Time of maximum: the time at which the maximum value is computed.
- Minimum: the minimum value during the simulation period, for each calculation point.
- Time of minimum: the time at which the minimum value is computed.
- Average: the average value during the simulation period, for each calculation point.
- Time step value: this column shows the instantaneous result values, corresponding to the date and time shown in the 'General' group and shown in the other result views (map, profile plots, etc.). Values in the 'Time step value' column therefore change when the time step of the results is changed.
If multiple result items are shown in the table (e.g. 'Node water level' and 'Node water depth'), the selected columns will be displayed for each of these result items.
Note
User defined columns, providing the result of a custom expression / equation, can also be added from the context menu. Refer to section Table below for more information.
Spatial statistics
Click 'Show statistics' to obtain statistics computed throughout the entire network, either for the current time step only or for the entire simulation period.
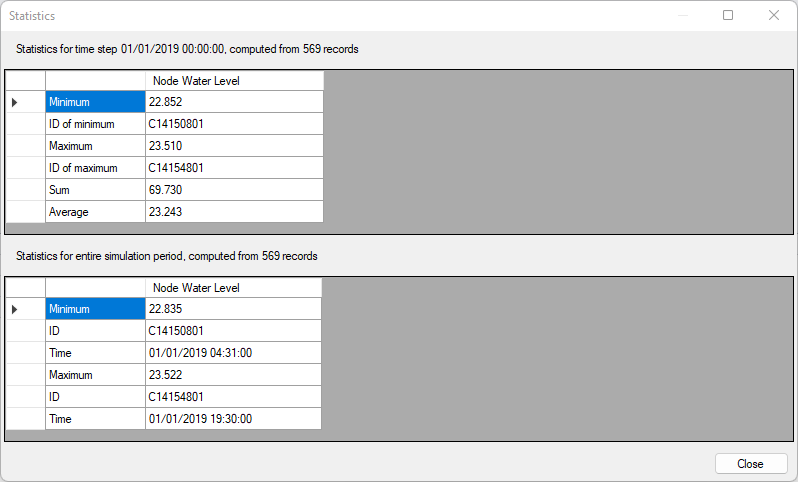
Figure: The spatial statistics tables
The 'Sum' statistics is not necessarily relevant for all result items. It is mainly relevant for 'Volume', 'Flooded area', 'Water flow rate to node volume about ground' or 'Mass error' result items.
Selection
Records in the results table can be selected independently of the selection of network items made on the map or in the model editors. The following buttons can be used to synchronize these two types of selection.
- Transfer to map: use the currently-selected records in the results table, and also select the corresponding items (nodes, pipes, rivers, etc.) in the model editors and on the map.
- Update from map: use the currently-selected records in the model editors and map, and select the corresponding items in the results table. If a selected item contains several result points (e.g. for rivers), then all records in the results table corresponding to the selected item will be selected.
- Load: use a selection saved to the 'Selection manager', and select the corresponding items in the results table. If an item from this selection contains several result points (e.g. for rivers), then all records in the results table corresponding to the selected item will be selected.
Table
The following controls are available above the main table:
- Filter: type some text to filter the list of shown item IDs, or use the drop-down list to show only some result types (nodes or links).
- Show selected: when this option is active, only the selected records in the table will be shown.
- Show single point in links: when this option is active, when some links contain several calculation points (i.e. several records for the same link), then only the first one will be shown in the table.
The context menu (right-click options) on the table offers the following options:
- Add item: Adds additional results for a specific location or a selection. To add additional result items for all locations (nodes or links), use instead the 'Results table' button in the ribbon to add more content to the existing table.
- Add user-defined column: Inserts additional columns to the table, with values derived from an expression. This expression can be a function of the result columns, as well as a function of the network properties (e.g. pipe diameter, node level, etc.).
- Save to plots manager: saves the result table (with its list of result items) to the 'Plots' panel. The result table will initially be added to the active folder from this panel. See Plots Management chapter for more information on options to save and manage results windows.
- Copy: Copies the values from the current selection.
- Select all: Selects all records in the table.
- Open selected in time series plot: Shows the time series from calculation points selected in the table. All result items added to the results table are shown in the time series plot.
- Export to text file: Exports the table to a text file in .csv format. This text file contains a table with columns separated by semicolons. All result items are listed in columns, whereas the various links and nodes are listed in rows.
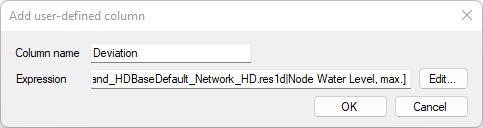
Figure: Defining the expression for a user-defined column
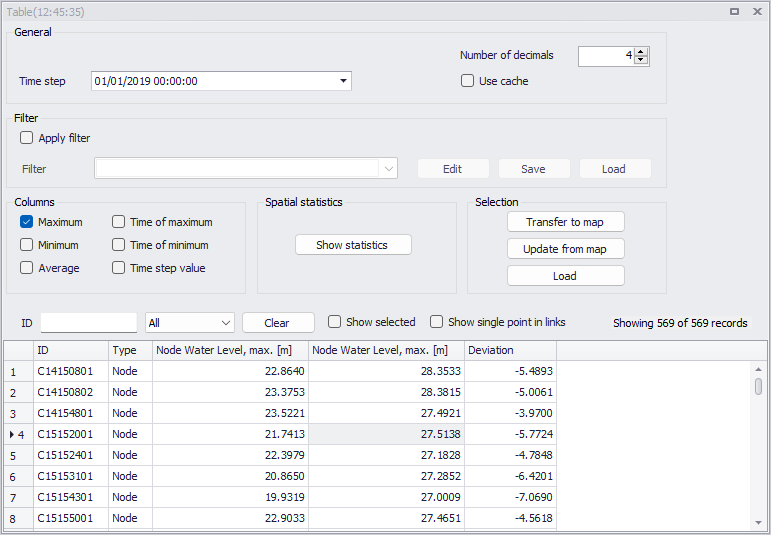
Figure: Example of user-defined column showing the difference of water level from two different result files
Info
When a table contains result columns from different result files, the file name can be seen in the fly-by text, while hovering over the column's header.