Tools and Plugins
The Tools and Plugins tab page in the Cross Sections editor offers several tools related to defining and processing cross section data.
Double-click on a tool name on the left panel to launch the tool.
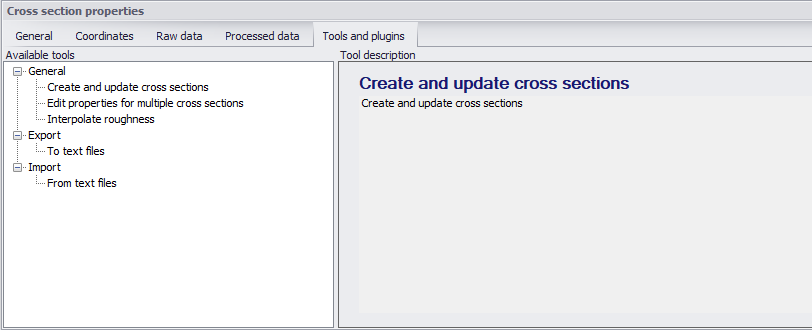
Figure: The Tools and Plugins tab page in the Cross Sections editor
Create and Update Cross Sections
The ‘Create and update cross sections’ tool offers possibilities for creating and modifying cross sections data. Launching the tool brings up a tabbed dialog (figure below), with various tab pages offering options that are relevant depending on the Method selected in the Method tab page.
To use the tool:
-
Choose the process to run on the Method tab page.
-
Configure settings in the data tab pages relevant for the selected method. For example, a method involving the use of DEM data will need configuration of parameters in the DEM Settings tab page.
-
Define where/for which river model elements (i.e. branch or cross sections) updates are made in the Input Selection tab page.
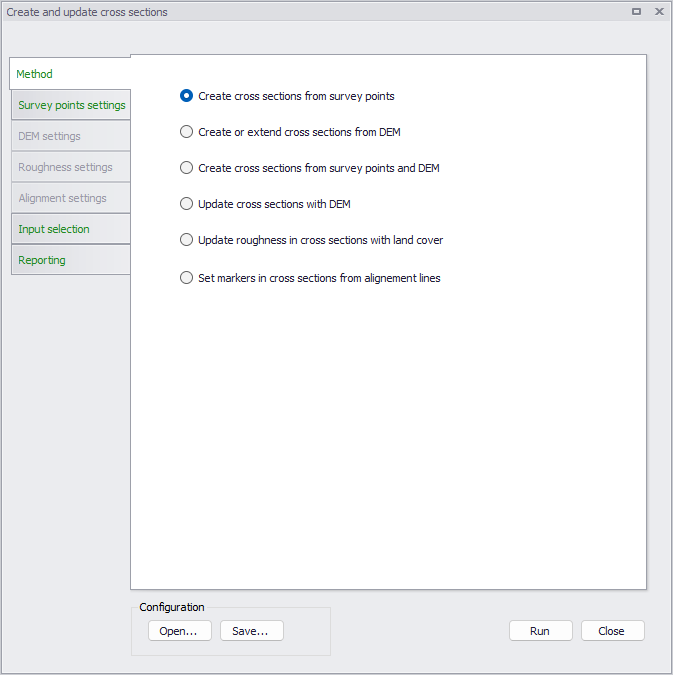
Figure: The dialog for the ‘Create and update cross sections’ tool
Method
Choose the desired operation to run from the Method tab page. The Method tab offers options to:
- Create cross sections from survey points: Option to define and extract cross section elevations from survey points.
- Create or extend cross sections from DEM: Option to create or add to cross section elevations data from a Digital Elevation Model (DEM).
- Create cross sections from survey points and DEM: Option to define and extract cross section elevations from both DEM and survey point data.
- Update cross sections with DEM: Option to modify cross section elevations from a Digital Elevation Model (DEM).
- Update roughness in cross sections with land cover: Option to modify/define cross section roughness from polygon feature layers/shapefiles, DFS2 rasters, or ASCII raster layers.
- Set markers in cross sections from alignment lines: Option to update the position of markers in cross sections, at intersections with alignment lines (polyline shape files, describing e.g. river bank locations). This operation will not alter the geometry of cross sections, but only update the marker positions according to the alignment line locations.
Survey Points Settings
Define parameters in the Survey Points Settings tab page if the selected option from the Method tab involves use of survey points data.
Point feature layers (i.e. point shapefiles and *.XYZ text files) loaded into the MIKE+ project may be used as survey point data.
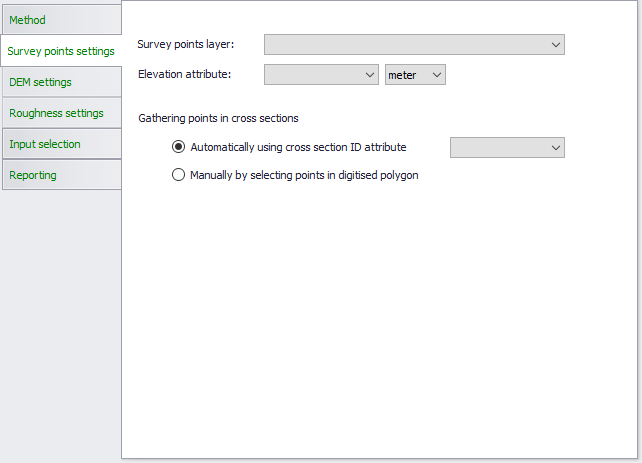
Figure: The Survey Points Settings tab
- Survey points layer: Select the pre-loaded feature layer (i.e. point *.XYZ or shapefile) to use as survey points data from the dropdown list. An external point layer file may also be loaded using the ellipsis button.
- Data formats in *.XYZ files should be:
- One row per point without header
- 3 mandatory columns in the order: X, Y and Z
- A fourth optional column with ID of the cross section to which the point belongs
- Both space and tab are accepted as column separators
- Both point and comma are accepted as decimal separators
- Elevation attribute: Select which numerical attribute in the chosen survey points layer represents elevation. This option is disabled for *.XYZ files.
- Gathering points in cross sections: Define which survey points are used in creating cross sections:
- Automatically using cross section ID attribute: With this options, the tool processes all points in one go. The survey point shapefile contains information on cross section IDs. Select the attribute in the shapefile that relates the individual survey points to a specific cross section from the dropdown menu. All survey points with the same ID field will be created as one cross section.
- Manually by selecting points in digitised polygon: For this option, the cross sections are created one by one. Use survey points within a polygon defined on the Main Map using the ‘Digitize’ button. Double-clicking on the Map ends the polygon creation, and a cross section is created using all the points from the layer in the digitised polygon.
The cross section is created as a straight line through the connected survey points using a least-squares fit. The individual survey points are projected orthogonally onto the cross section line as shown below in the figure below.
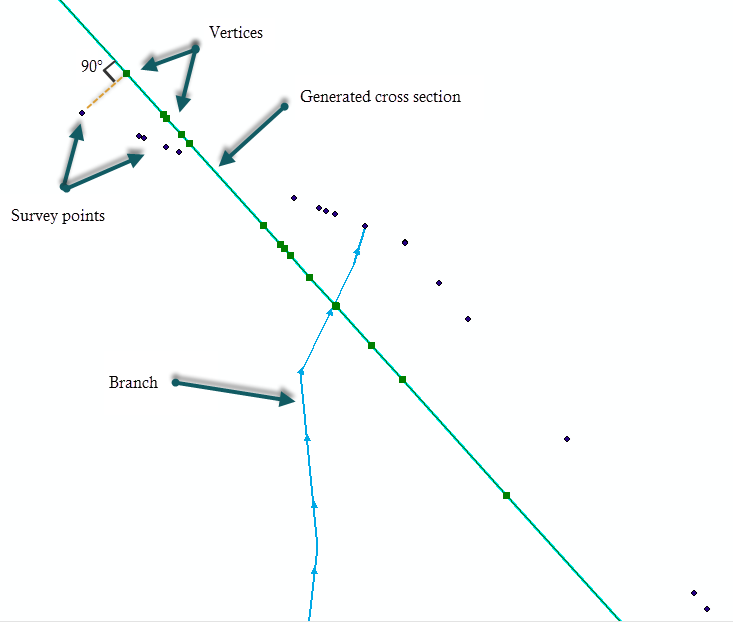
Figure: Survey points projected onto cross section line
DEM Settings
Define parameters in the DEM Settings tab page if the selected option from the Method tab involves the use of DEM data (i.e. in creating or updating cross sections).
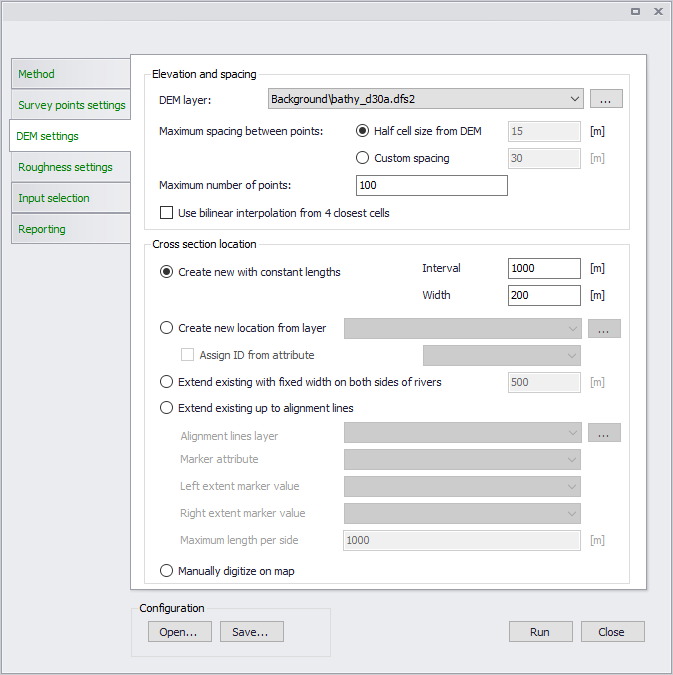
Figure: Options in the DEM Settings tab
The following settings may be configured:
- DEM layer: Select or define the DEM raster layer to use in the processing. A pre-loaded raster layer may be selected from the dropdown list, or an external raster file may be loaded using the ellipsis button. Valid rasters include ESRI ASCII, DFS2 files, GeoTIFF files, and ESRI binary grids.
- Maximum spacing between points: The maximum spacing between points along the cross sections can either be user-specified or set per default to half the cell size of the DEM. The selected spacing between points is kept only if the created number of points remains lower than the specified maximum number of points. If this maximum number of points is reached, the spacing between points is increased accordingly.
- Maximum number of points: Should the specified maximum spacing between cross section points result in more than the allowed maximum points, the spacing is increased to obtain the maximum number of points. The maximum number of points is always the total number of points in the cross section: when extending existing cross sections, it also includes the number of points in the original cross sections.
- Use bilinear interpolation from 4 closest cells: When active, bilinear interpolation is used when extracting cross section z-values from the DEM cells. If unchecked the z-value in the cross section profile will be the exact value from the DEM cells that are intersected, whereas if bilinear interpolation is used, z-values will be the interpolated z-value from the 4 closest neighbouring DEM grid cells.
- Create new with constant lengths: With this option, new cross sections are generated with a regular interval and with the specified width. An additional cross section is also always added at the downstream end of the river.
- Interval: Distance between cross sections to be generated.
- Width: This defines the width of the generated cross sections. Cross section lines will be located with half of the width distance on each side of the river centre line.
- Create new at locations from layer: Use a shapefile containing cross section polylines at the requested locations along the rivers in the model. Select the shapefile to use from the dropdown list of available shapefiles or load a shapefile using the ellipsis button.
- Cross sections will only be generated where shapefile geometries intersect with the selected river branch. The cross section will be generated as a straight line from the first to the last point in the line shape.
- It is possible to automatically assign an ID to each generated cross section by activating the option ‘Assign ID from attribute’. This ID is obtained from the shapefile attribute selected in the dropdown list.
- Extend existing with fixed width on both sides of rivers: Widen cross sections on both sides of rivers as much as the length specified in the input box. Topography along the extended parts of cross sections is obtained from the underlying DEM.
- Extend existing up to alignment lines: Use alignment lines to extend the width of existing cross sections. Topography along the extended parts of cross sections is obtained from the underlying DEM.
- Manually digitize on map: Create a cross section along a line defined interactively on the Map. Cross sections will only be generated if they intersect a river. Click the 'Digitize' button to draw cross sections locations on the map. Double-click to stop digitizing a cross section, before digitizing additional locations if necessary. Right-click when all locations are digitized, to create the cross sections.
Creating cross sections requires that ‘Elevation and Spacing’ options are defined. This requires that a DEM is selected, and that the spacing between points as well as the maximum number of points are specified. When extending a cross section, the specified maximum number of points corresponds to the total number of points in the extended cross section, including original points.
If a cross section intersects with more than one alignment line of the same type, the alignment line closest to the river is used.
Roughness Settings
Configure parameters in the Roughness Settings tab page when using the ‘Update roughness in cross sections with land cover’ option.
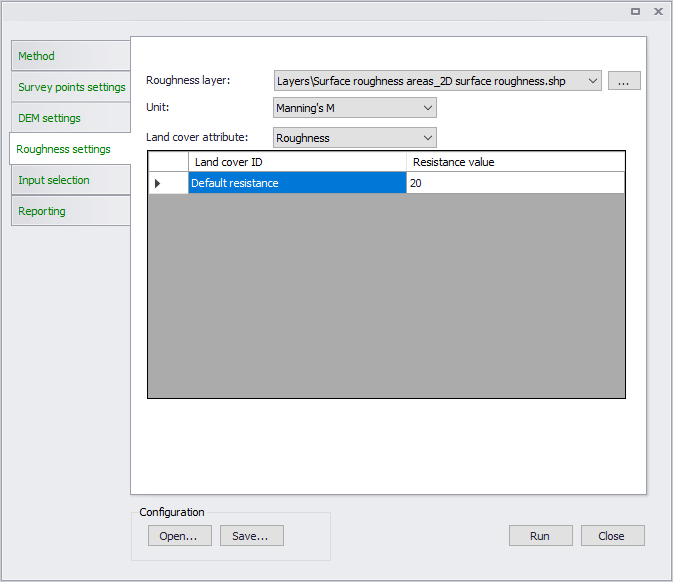
Figure: The Roughness Settings tab page
- Roughness layer: Select or load the raster or polygon feature layer to use in the processing. Select valid pre-loaded shapefiles or rasters from the dropdown list, or point to external files using the ellipsis button.
- Polygon feature layer: Selecting a polygon feature layer requires further definition of feature attributes and corresponding resistance values.
- Raster layer: Values as defined in the raster layer are used as resistance values in the processing.
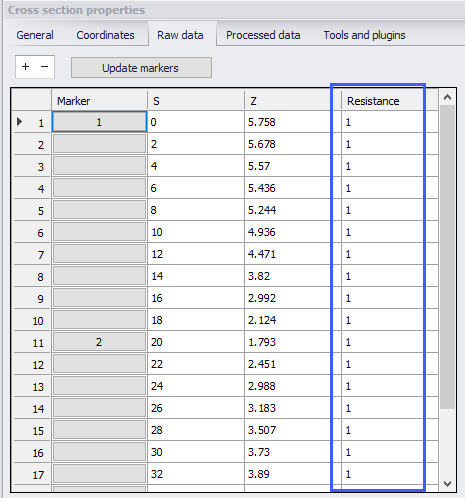
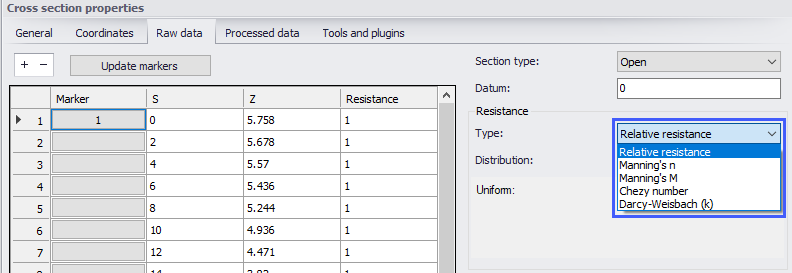
- Unit: Defines the Resistance Type for the values being defined (see Cross Sections Raw Data):
- Relative resistance
- Manning’s n
- Manning’s M
- Chezy number
- Darcy-Weisbach (k)
- Land cover attribute: If the Roughness Layer is a polygon feature/shapefile layer, define the feature attribute representing Resistance values from the dropdown list. Attributes with integer values can be used.
The secondary table lists unique resistance attribute types from the feature layer. The first row shows uneditable information for 'Default resistance' used for areas not covered by features in the layer. Define corresponding resistance values for each attribute type.
Alignment settings
This tab is used to control how cross sections markers are to be updated, when using the method 'Set markers in cross sections from alignment lines'.
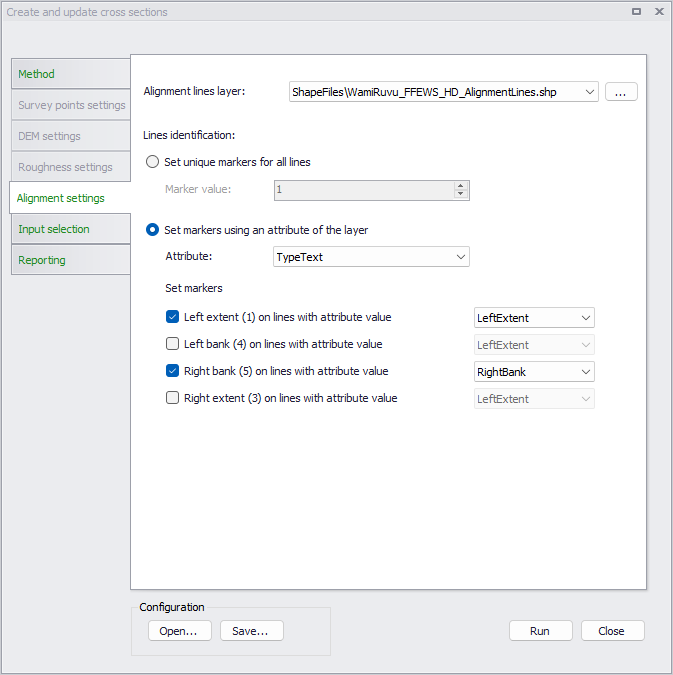
Figure: Options in the Alignment settings tab
This operation will not alter the geometry of cross sections, but only update the marker positions according to the alignment line locations. If the cross section does not contain a point at the marker position a new point is inserted with an elevation interpolated from the previous and next point in the cross section. If a cross section does not intersect with an alignment line, the marker is not updated. If a cross section intersects with more than one alignment line of the same type, the alignment line closest to the branch is used.
Select or define the alignment line shape file in the 'Alignment lines layer' list. A pre-loaded layer may be selected from the dropdown list, or an external shape file may be added using the ellipsis button. Only shape files containing polylines are valid for this tool.
Two different options are available to set markers at intersections with the polylines in the shape file:
- Set unique markers for all lines: with this method, the same marker value will be applied at all intersections between the processed cross sections and any alignment line. The applied marker value must be specified in the 'Marker value' field. This method can apply any marker value to the cross sections, although only values from 1 to 5 are used by MIKE+ (higher values will be used as user-defined marker).
- Set markers using an attribute of the layer: with this method, the value to be applied will be read from an attribute of the selected shape file. It therefore allows to process different markers with the same shape file. When using this method, the following settings are used:
- Attribute: this list shows all attributes in the selected shape file. Select the attribute defining the marker value to be updated. The attribute can contain either a numerical value or a text.
- Set markers: this method can update the position of markers 1, 4, 5, and/or 3. Tick the makers to be updated using the available boxes. For each selected marker, select the corresponding value in the shape file's attribute. The given marker will be set at the intersection with an alignment line, only if the line's attribute contains the selected value.
Input Selection
Define which parts of the river model are involved in the processing in the Input Selection tab page.
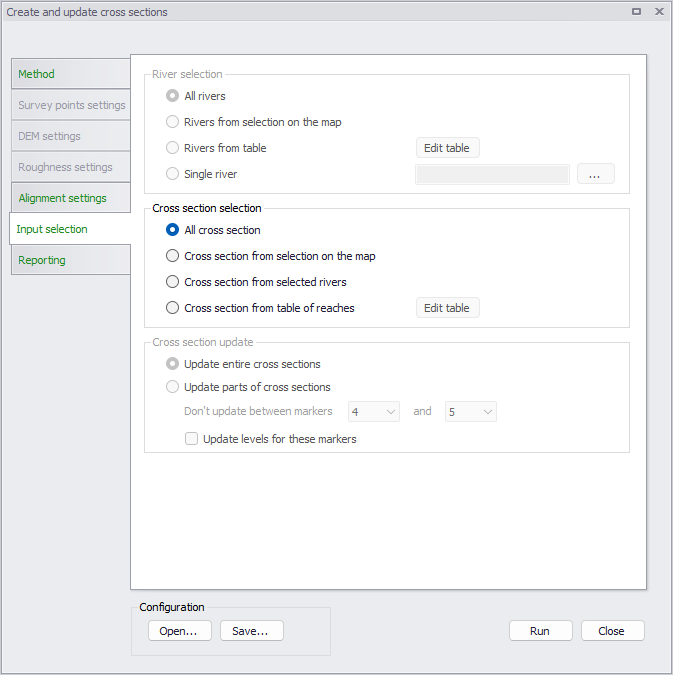
Figure: Options in the Input Selection tab
The tab page presents options for selecting river branches and reaches to involve in the processing as appropriate for some methods. It also has options for selecting cross sections, or parts of cross sections, relevant for other methods.
- Rivers selections:
- All rivers
- Rivers from selection on the map
- Table of reaches: The reaches are defined using the ‘Edit table’ button.
- Single river: Define the river in the input box.
- Cross sections selections: Relevant for selecting the cross sections to process.
- All cross sections: All cross sections in the model will be updated.
- Cross sections from selection on the map: Only the selected cross sections will be updated.
- Cross sections from selected rivers: Only the cross sections on the selected river branches will be updated.
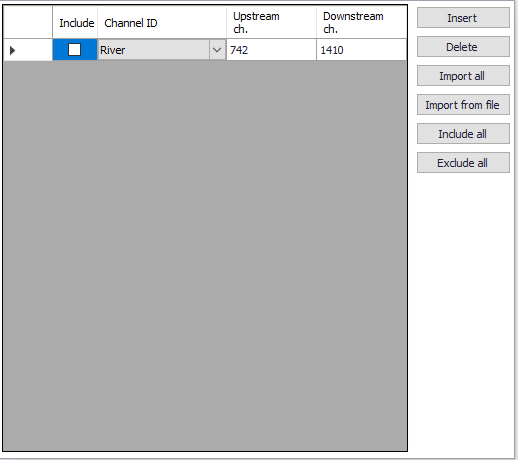
- Cross sections from table of reaches: The reaches are defined using the ‘Edit table’ button. The locations of cross sections to be updated are specified in a table, offering flexible options to control the branches to be included, and also the range of chainages for each branch where cross sections are updated. Cross sections are updated only between the specified lowest and highest chainages, and if the box is checked in the 'Include' column.
The ‘Edit table’ buttons present a dialog wherein river branches and reaches to include in the processing may be easily defined in a list.
- Cross sections update: Relevant for selecting which parts of (selected) cross sections to process.
- Update entire cross sections: This updates the elevation data all along the cross sections.
- Update parts of cross sections: For updating only parts of cross sections.
Use the ‘Don’t update between markers’ option to define segments along cross sections to exclude from editing based on marker values.
Tick the ‘Update levels for these markers’ option to allow levels of the selected markers to be updated/adjusted. Levels at the selected markers are unchanged if the option is unchecked.
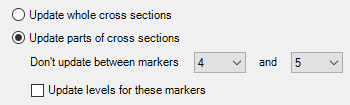
As an example, it is possible to update the elevation data only in the floodplain by use of markers 4 and 5, which may be located on the banks. If banks levels are obtained from a survey which is assumed to be more accurate that the DEM used to update the floodplain, then the option should remain unchecked in order not to update the bank levels. On the opposite, if the new DEM is assumed to be more accurate than original data describing the banks, the option should be checked to update the bank levels as well.
Reporting
The Reporting tab page shows information about the tool execution. Use the ‘Save report’ option to generate a file copy of the execution log. The ‘Clear report’ button clears the contents of the execution log shown in the dialog.
Figure: The Reporting tab
Buttons
- Run: Generates or updates cross sections following the specifications in the dialog.
- Digitize: Used to define the polygon for manually selecting the survey points to use. Also executes the tool after defining the polygon.
- Open: Loads a previously-saved *.XML configuration file for the tool.
- Save: Saves the tool configuration to an *.XML file.
- Close: Closes the tool.
Edit Properties for Multiple Cross Sections
Use this tool to make multiple changes to raw and/or processed data for cross sections and apply them to multiple cross sections at the same time (figure below). To use the tool:
-
Select the parameters to edit from the Properties groupbox by ticking on the corresponding checkboxes for parameters of interest. The parameters are grouped into sections corresponding to their location (i.e. Raw Data, Processed Data, or Coordinates tab page).
-
Specify new values/settings for these parameters in the dialog.
-
Under the ‘Apply to’ groupbox, define for which cross sections the changes are applied from among the available options.
-
Click on the ‘Update’ button to run the tool. A status log for the tool execution is shown at the bottom of the dialog.
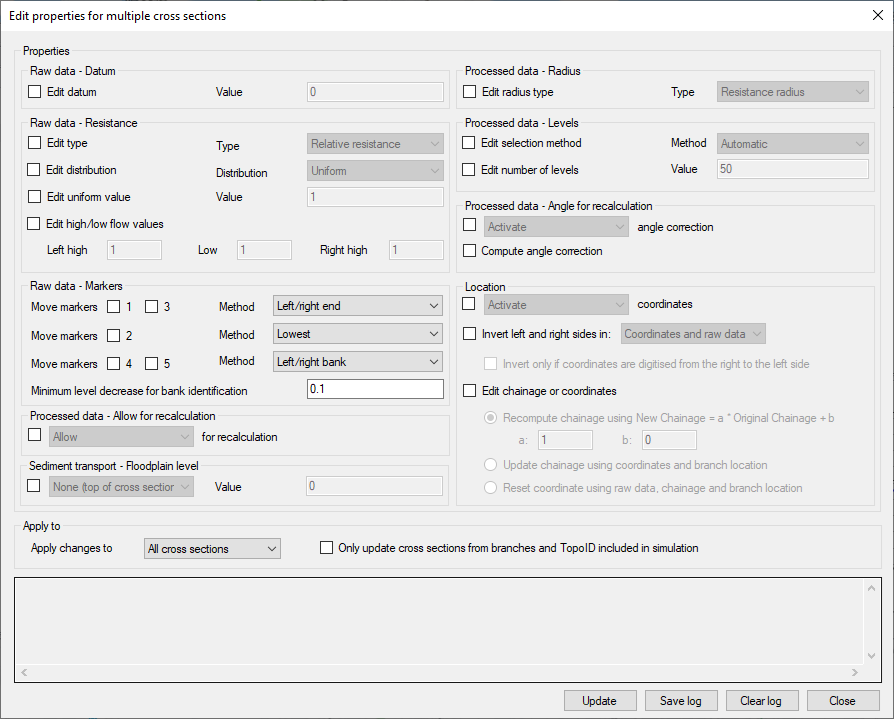
Figure: Dialog for the ‘Edit properties for multiple cross sections’ tool
Raw and Processed Data
The following raw and processed data parameters may be modified with the tool:
- Raw data - Datum: The datum of the cross section can be changed here.
- Raw data - Resistance: A change of transversal distribution, resistance type definition and resistance values can be set here.
- Raw data - Markers: Multiple options are available to move markers. Markers 1 and 3 can be moved on river banks or to cross sections extents. Markers 4 and 5 can be moved to river banks. Marker 2 can be set either at the lowest point or at the intersection with the branch.
- The tick-boxes in front of the maker values determine which markers should be updated as only selected marker values will be updated.
- Additionally, when markers are moved to river banks, a minimum decrease of elevation must be specified to identify the location of the banks.
- Processed data - Allow for recalculation: The option 'Allow for recalculation' of the processed data can be activated or deactivated here.
- Sediment transport - Floodplain level: The floodplain level used in river model Sediment Transport calculations can be defined here. When it is set to User defined, the corresponding value must also be specified.
- Processed data - Radius: The radius type can be changed here.
- Processed data - Levels: The levels selection method, as well as the number of levels used for determining the processed data, can be changed here.
- Processed data - Angle correction: Activating or deactivating the angle correction respectively checks or unchecks the 'Apply' angle correction in the processed data.
- Computing the angle correction edits the angle value.
Location
Activating or deactivating the coordinates respectively checks or unchecks the 'Apply' option in the Coordinates tab.
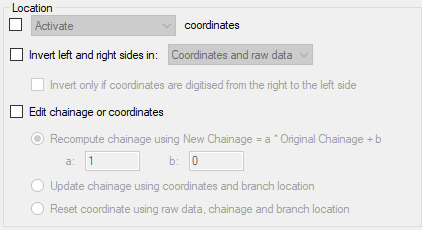
Inverting left and right sides of the cross section swaps either the coordinates of the cross sections, the raw data or both. The option 'Invert only if coordinates are digitised from the right to the left side' allows to perform this change only in case the cross section's coordinates have been provided in the wrong direction.
Several options are available to edit the chainages or coordinates:
- Recomputing the chainage with the formula New Chainage = a * Original Chainage + b, where a and b can be changed manually.
- Updating chainages of cross sections by using the cross sections coordinates and the position of the branch to identify their intersection. This may be used after moving a cross section on the map, to reflect the change in the chainage and therefore in the simulation.
- Resetting the coordinates: this will fill in the Coordinates table, assuming that the cross section is perpendicular to the branch and that marker 2 is aligned with the branch.
Apply to
The selected changes can either be applied to all cross sections, or only to the selected ones.
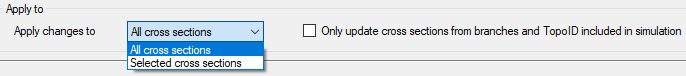
If the option 'Only update cross sections from branches and TopoID included in simulation' is checked, all cross sections defined for non-existent branches, or under a different Topo ID than the one used for the branch in the simulation, are ignored.
Buttons
- Update: Applies the selected changes to the cross sections.
- Save log: Saves the messages issued during the update to a text file.
- Clear log: Clears the log-messages in the text box above the buttons.
- Close: Closes the tool.
Interpolate resistance
The tool 'Interpolate resistance' may be used to perform a linear interpolation of resistance values, and assign them to cross sections.
Note
The tool doesn't change the resistance distribution type for the cross sections, i.e. it may for example change the 'Uniform' value for a cross section which uses the type 'High / low flow zones' but in this case the cross section won't use the modified value in the simulation until its distribution type is changed.
Option
It is possible to select between two different types of values to be interpolated:
- 'Uniform': this is used to change the 'Uniform' resistance value of the cross sections
- 'High/low flow zones': this is used to change the 'Left high flow', 'Low flow' and 'Right high flow' values of the cross sections.
The input resistance values to be interpolated are entered in the table. Each row contains a location (River ID and chainage) and resistance value(s). The locations specified in this table don't have to match the cross sections locations. When the cross sections are updated, values from this table are interpolated linearly as a function of the chainage, and are then assigned to cross sections found within the range of chainages defined between the smallest and the highest chainage specified for each river. When a cross section's chainage is out of the specified ranges, it is not processed.
Two buttons are available above the table:
- 'Import all sections': adds one row for each cross section's location existing in the model definition. Only the cross sections from the active Topo ID (Topo ID selected in the 'Rivers' editor) are imported.
- 'Import selected sections': adds only the cross sections being selected.
Apply to
The selected changes can either be applied to all cross sections, or only to the selected ones. Regardless of the selected option, only the cross sections lying within the range of chainages specified in the table are updated.
If the option 'Only update cross sections from branches and Topo ID included in simulation' is checked, all cross sections defined on non-existing rivers, or on a different Topo ID than the one used for the river in the simulation, are ignored.
Buttons
- Update: Applies the selected changes to the cross sections.
- Save log: Saves the messages issued during the update to a text file.
- Clear log: Clears the log-messages in the text box above the buttons.
- Close: Closes the tool.
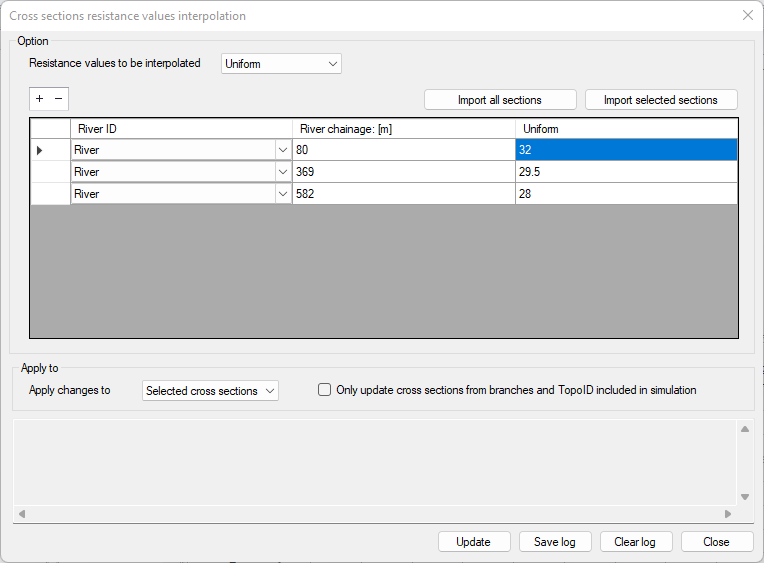
Figure: The resistance values interpolation tool
Export to Text Files
This tool is used to export cross section data to a text file. Executing the tool opens a dialog, where one defines:
- The file name and path for the text file to be created. In this dialog, you can choose to export three types of data:
- Raw data only: this will export most of the properties of the cross- sections (coordinates, elevation data and other properties)
- Raw data and processed data: this will export the same data as with the option ‘Raw data’ as well as the table of processed data.
- Marker levels and coordinates: this will not export the main properties of the cross sections, but only some specific selected information, including:
- o.Levels at the various markers' locations
- o.Minimum level from marker 1 and 3 (minimum levee level)
- o.Minimum level from marker 4 and 5 (minimum low flow bank level)
- o.XY coordinates at intersection with river (coordinates of the calculation point along the river)
- o.XY coordinates at left or right end of cross section (coordinates of the first or last points of the cross sections, regardless of position of markers 1 and 3).
- Under the 'Apply to' groupbox, choose between exporting all cross sections or only currently selected cross sections.
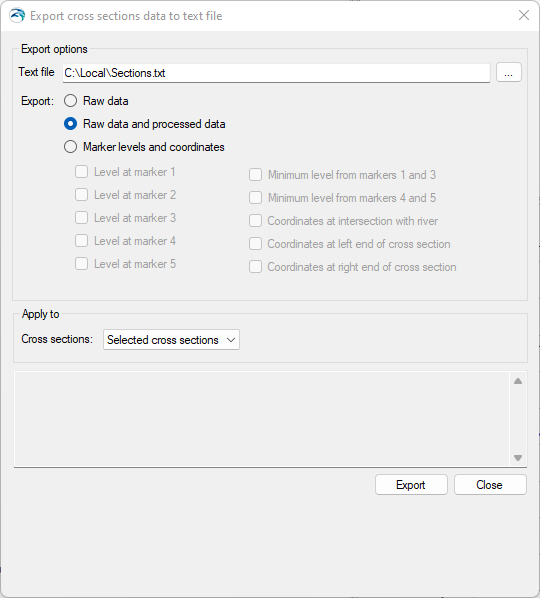
Figure: Dialog for the ‘Export to text files’ tool
Import from Text Files
Use this tool to import cross section data from a text file. This facility reads raw topographical data as well as additional cross section properties for MIKE+.
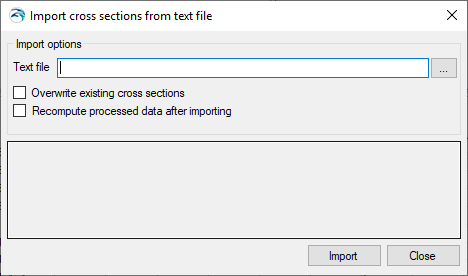
Figure: Dialog for the ‘Import from text files’ tool
Executing the tool opens a dialog (figure above) where the text file to import should be defined.
This dialog also contains an option for overwriting existing cross sections when a cross section already exists at the location of an imported cross section. When this option is left unchecked, cross sections in the text file will not be imported when other cross sections already exist at the same location.
When ‘Recompute processed data after importing’ is selected, the table with processed data is automatically recomputed for each imported cross section.
Text file format
As a minimum, each cross section must contain the following information, in this order:
In order to also import topographical data, a cross section needs a profile section, indicated by a ‘PROFILE N’ row, where N is the number of rows below containing the S-Z data.
Each cross section data must end with a row containing stars:
*******************************
There are no limits to the number of cross sections which can be imported from a text file.
Example
An example text file for importing two cross sections is shown below:
Note
Columns can be space-delimited or tab-delimited. Any white space or tab at the beginning of a row will be ignored during the import process. All numerical values should be entered in international (SI) units.
Additional cross section properties may also be imported from the text file using additional and optional sections in the text file. Except for location information (Topo ID, Branch name and chainage) which must be the first sections for each cross section, all other sections can be added in any order in the text file for each cross section.
Usually, these additional sections consist of a first row identifying the river parameter, and one or more rows below with the corresponding values to be imported.
Tip
It is possible to use the tool for exporting cross sections to get an example of a text file containing all properties that the importer can handle.
A list of possible additional properties is provided below:
- PROFILE: Additional columns can be added to the right of the S and Z columns to import distributed resistance numbers (third column) and markers (fourth column). Markers are identified with the following tags:
- <#1> marker 1
- <#2> marker 2
- <#4> marker 3
- <#8> marker 4
- <#16> marker 5
- <#32> marker 6
- <#64> marker 7
- When multiple markers are added to the same point of the cross section, the number to be inserted in the text file corresponds to the sum of numbers associated to these markers. For instance, <#6> will import markers 2 and 3 to the same point. Additionally, the following data may be added:
- User marker in the fifth column
- X and Y coordinates for each point of the cross section in eighth and ninth columns respectively. Sixth and seventh columns are not used, and should be set to 0 for backward compatibility reasons in order to add coordinates. Note that when importing X and Y coordinates, it is important that specified S values are consistent with distances computed from these coordinates.
- COORDINATES: The line with numerical values first contains an indicator, which can be:
- 0: The coordinates are not applied. In this case, no coordinates have to be specified afterwards.
- 3: The coordinates are applied. In this case, this indicator is followed by another value on the same line, providing the number of sets of coordinates to be specified. Each set of coordinates is then provided as a separate line below, containing successively S, X, and Y values.
- CLOSED SECTION: This section can be added to import the cross section as a closed section. In this case, a value of 1 has to be added in the row below.
- PROTECT DATA: When this parameter is set to 0, the 'Allow for recalculation' checkbox is checked. It is unchecked for a value of 1.
- DATUM: Datum value for the cross section in meters.
- RADIUS TYPE: Numerical code indicating the radius type for the cross section, which can be:
- 0: Resistance radius
- 1: Hydraulic radius using effective area
- 2: Hydraulic radius using total area.
When this section is not inserted, the default option (Resistance radius) is applied, except for closed sections, where the default is 2.
- SECTION ID: Optional identifier for the cross section.
- INTERPOLATED: The 'Interpolated' flag indicated by a star in the cross sections tree. It is set either to 0 (Not interpolated) or 1 (Interpolated)
- ANGLE: The correction angle used in the processed data. It is followed by a line with two numerical values:
- The angle value
- A value 0 when the angle correction is not applied, or 1 when applied.
- RESISTANCE NUMBERS: This section contains seven numerical values, as described and in the order below:
- Transversal distribution, with a value of 0 for Uniform, 1 for High/low flow zones, and 2 for Distributed
- Resistance type, with a value of 0 for Relative, 1 for Manning n, 2 for Manning M, 3 for Chezy, and 4 for Darcy-Weisbach
- Uniform resistance value
- Resistance value for left high flow zone
- Resistance value for low flow zone
- Resistance value for right high flow zone
- Resistance value for a vegetation zone
- PROCESSED DATA: Processed data for cross sections may also be imported in case it is not desired to use values recomputed by the program. The next two lines are text lines containing headings. Each row of the processed data table is then added as a separate line below, and with the following columns (in this order):
- Level
- Cross section area
- Hydraulic radius
- Width
- Additional flooded area
- Resistance factor