Flushing analysis
Flushing of pipelines is a common practice used by water utilities to clean pipelines in their water distribution systems. The conventional way to flush pipelines is just to open selected fire hydrants successively and let them flow until the flowing water appears clean. Unidirectional flushing (UDF), which is a more effective way to flush pipelines. involves closing or opening selected valves to direct flow through target pipes in order to achieve higher velocities for the same hydrant flows. The set of valves that need to be operated and hydrant that is opened is called a flushing sequence.
The flushing analysis can be used in two modes:
- Conventional flushing
- Unidirectional flushing.
Conventional flushing can run in a batch mode when the program will simulate the flushing successively for every selected outlet. For every outlet, the program will compute the actual flushing time required to flush (exchange) the water in the selected pipelines. The actual flushing time can be extended by a safety factor that multiplies the minimum required flushing time. The idle time in between switching the outlet nodes can also be specified.
Unidirectional flushing will not run in a batch node, it will run for one specific outlet node but it will allow the user to close additional number of valves (pipes) in order to maximize the flushing result. The program can assist in finding sections valves need to be closed and then it will determine pipes that need to be closed for the simulation.
Flushing velocity i.e. maximum velocity as well as the change in the velocity achieved during the flushing sequence is very important for the success of cleaning pipes. These are some of the recommended values:
- 0.9 m/sec or 3 ft/sec removes sediment and lowers disinfectant demand
- 1.5 m/sec or 5 ft/sec removes biofilm and promotes scouring
- 3.7 m/sec or 12 ft/sec removes sand from inverted siphons.
It is encouraged to achieve a 1.5 m/sec or 5 ft/sec on every flush.
The Flushing Analysis dialog box is reached by selecting ‘Model type’ from General Settings from the Table of Contents and then by selecting the ‘Flushing analysis’ option. Note that to run the flushing analysis, you need to select Run from within the Flushing Analysis dialog box.
Settings
A list of the Flushing settings, with a short description given for each one.
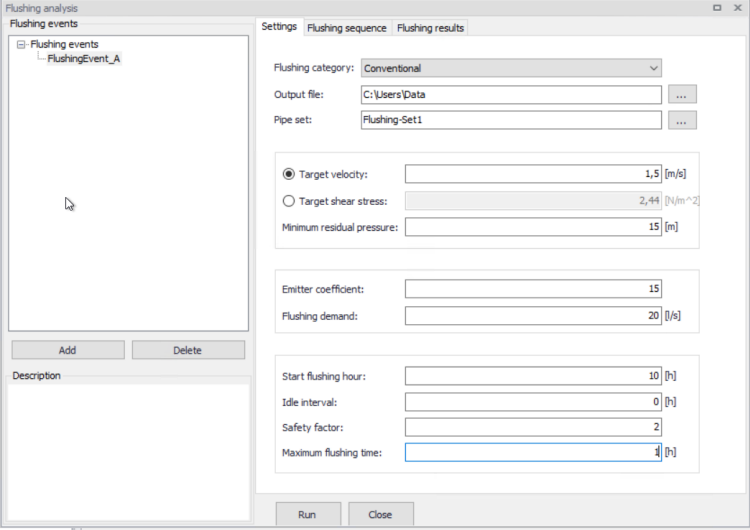
Figure: The 'Settings' tab in the 'Flushing analysis' editor
- Flushing events: This data entry allows you to add flushing events that are further specified by data in the right-hand side of the dialog. You can add and delete flushing events using “Add” and “Delete”.
- Flushing category: Select from conventional and UDF unidirectional flushing.
- Output file: This data entry allows you to specify where the output report with flushing analysis results will be stored.
- Pipe set: This data entry allows you to select a pipe set with pipes that will be used in flushing i.e. pipe to be flushed. In order to define the pipe set, use Selection from the main application menu and create a selection list.
- Target velocity: This entry allows you to define the target velocity that will be used to quantify the success of flushing event.
- Target shear stress: This entry allows you to define the target shear stress that will be used to quantify the success of flushing event.
- Minimum residual pressure: This data entry allows you to define the minimum residual pressure within the flushed pipes during the flushing event. If the actual (computed) residual pressure would be smaller than the minimum residual pressure, the program will report it.
- Emitter coefficient: This data entry allows you to define the emitter coefficient that will be inserted by the program to the outlet node and used in flushing. The program will change the outlet node to an emitter node when you select this option. Hydrant flows may be specified directly in flow units or as an emitter coefficient. For standard North American hydrants that comply with AWWA Standard C502 or C503, the emitter coefficient would be 150-180 \(\text{gpm}/\text{psi}^{0.5}\) (11-14 \(\text{l/s}/\text{m}^{0.5}\)) for the 2.5 in (63 mm) outlet and 380-510 \(\text{gpm}/\text{psi}^{0.5}\) (30-40 \(\text{l/s}/\text{m}^{0.5}\)) for the 4.5 in (115 mm) outlet depending on the model of hydrant, size of barrel and length of barrel. In terms of flow units, free discharge from a hydrant can vary from 500 to 1500 gpm (32-95 l/s) depending primarily on the strength of the distribution system at that point. Note, that the emitter coefficient needs to be entered in flow units matching the model flow units.
- Flushing demand: This data entry allows you to define the demand that will be inserted by the program to the outlet node and used in flushing.
- Start flushing hour: This data entry allows you to define the start time of the flushing event.
- Safety factor: This data entry allows you to prolong (extent) duration of the flushing. The program computes the flushing time by tracking the volume of water that was initially contained in the flushed pipes and how much of that volume was replaced by fresh water from the start node (source node). The safety factor bigger than 1 allows you to prolong the flushing above the minimum flushing time.
- Maximum flushing time: This data entry allows you to define the maximum duration of the flushing event. The simulation will stop when the maximum flushing time is reached regardless whether pipes were completely flushed or not.
Flushing sequence
A list of the Flushing sequence settings follows, with a short description given for each one.
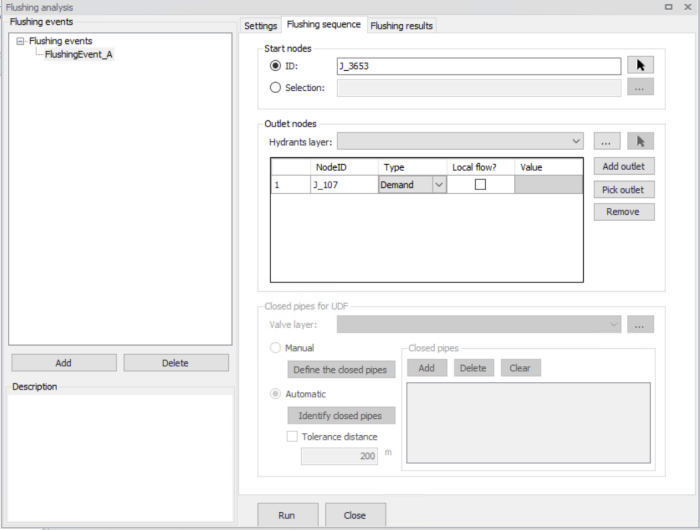
Figure: The 'Flushing sequence' tab in the 'Flushing analysis' editor
- Start nodes: This data entry allows you to define the source of fresh water, this could be the starting node of the first pipe in the flushing sequence or this could be any other node in the network. The selected node will be used by the program for accounting for water that is flushed in the selected pipes during the flushing event. Note, that it is possible to select multiple nodes in case that the pipes selected for flushing are receiving water from different entry points.
- Outlet nodes: This data entry allows you to define the outlet node that is used to flush the water out of the selected pipelines. The amount of water that is leaving the system through this node is determined by the program based on the flushing demand or emitter coefficient defined in Settings. Note, that every outlet can inherit flushing demand or emitter coefficient from the general settings or that these entries are defined specifically for the outlet. If you wish to use different settings per outlet, select “local flow” and enter the required value for the flushing demand or emitter coefficient.
- Closed pipes for UDF (unidirectional flushing): This data entry allows you to define pipes that will be closed by the program during the unidirectional flushing. In order to select such pipes, use “Add”, “Delete”, and “Clear”.
- Valve layer: This data entry allows you to automatically identify pipes that will be closed by the program during the unidirectional flushing by selecting isolation valves from the Valve layer that will be closed in the physical system. In order to select the shapefile with such valves, use “Valve layer” selection and locate the data source with valves. Next, define the tolerance distance that will be used by the program to find the pipe that is nearest to the selected isolation valve.
Running simulation
Select “Run” from within the Flushing editor in order to run the simulation. The simulation progress will be displayed in the application status window. The simulation can be interrupted (cancelled) by pressing “Esc”.
Flushing Results
Results of the flushing simulations can be displayed in different ways. They are written into an output .csv file. This .csv file is a comma-separated text file in a format that is suitable for importing into Microsoft Excel, for example.
Tabular Results
The tabular results can be displayed directly from within the Flushing Analysis editor, in the “Flushing results” tab.

Figure: Flushing analysis results
Report
Generate a report document from Flushing Analysis results using the 'Report' button in the Flushing Analysis editor. It summarizes values for various result items in formatted tables.
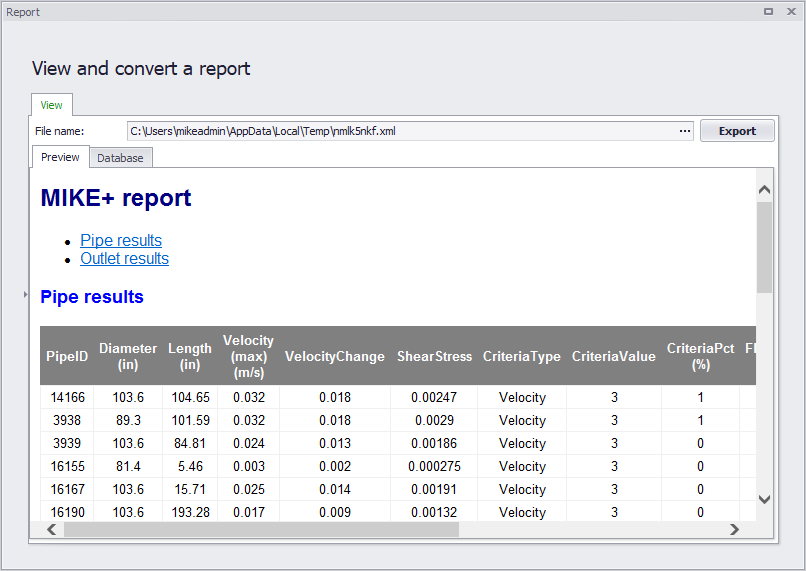
Figure: Example Flushing Analysis report
Thematic Maps
The simulated flushing results can be displayed using the colour coded maps. Select Layers and Add Layer and select one of the flushing result items to create a colour coded map with the fire flow results.
List of available flushing result items:
- Pipes:
- Pipe ID: unique pipe identifier.
- Velocity (max): maximum velocity reached during the flushing event in the pipe
- Velocity change: difference between the flow velocity before flushing and the maximum velocity during the flushing event.
- Shear stress (max): maximum shear stress reached during the flushing event in the pipe.
- Criteria percentage (%): the value indicates how well the flushing criteria was fulfilled during the simulation. Value of 75%, for example, would mean that if the required velocity was e.g.1.5 m/s then the actual maximum velocity reached during the flushing was 75% of that value, i.e. 0.75 * 1.5 = 1.125 m/s.
- Flushing Time(min): the program computes the minimum time required to fully replace the pipeline volume be a fresh water from the flushing source. This time can only be computed in case that it was actually possible to replace 100% of the pipeline volume. In case that the volume of replaced water in the pipeline was not 100%, the minimum flushing time is not computed and the value is set to “-1”.
- Flushing percentage (%): the value represents the % of water the water that was replaced in the pipeline during the flushing. Value of 85%, for example, would mean that 85% of the pipeline volume was replaced by a fresh water originating from the source of flushing.
- Comment: description indicates the flushing success e.g. pipeline flushed, pipeline flushed but criteria not reached, pipeline not flushed.
- Outlets:
- Outlet ID: unique node identifier.
- Start (hrs:min): start of a flushing event is calculated from the start of the whole flushing sequence and from the idle interval in between flushing events.
- End (hrs:min): end of a flushing event is calculated from the start time and duration of a flushing sequence.
- Duration (hrs:min): duration of a flushing event. The duration of a flushing even is computed from the minimum flushing time and a safety factor. In case that the maximum flushing duration was reached, the duration is equal to the maximum flushing duration.
- Average discharge (flow units): average flow in a pipe during the flushing event
- Water volume (volume units): volume of water that was discharge (flushed) from the outlet during the flushing event.
- Average flushing success (%): average flushing success from pipes i.e. a percentage indicating of how well the pipe is flushed weighted by a pipe length.
- Average flushing velocity (%) : average flushing velocity from pipes.