Map Window
The main Map window displays a layout plot of the pipe network system. The individual model elements (i.e. nodes, pipes, pumps, etc.) are displayed. The Map window also allows the user to graphically layout the pipe network system.
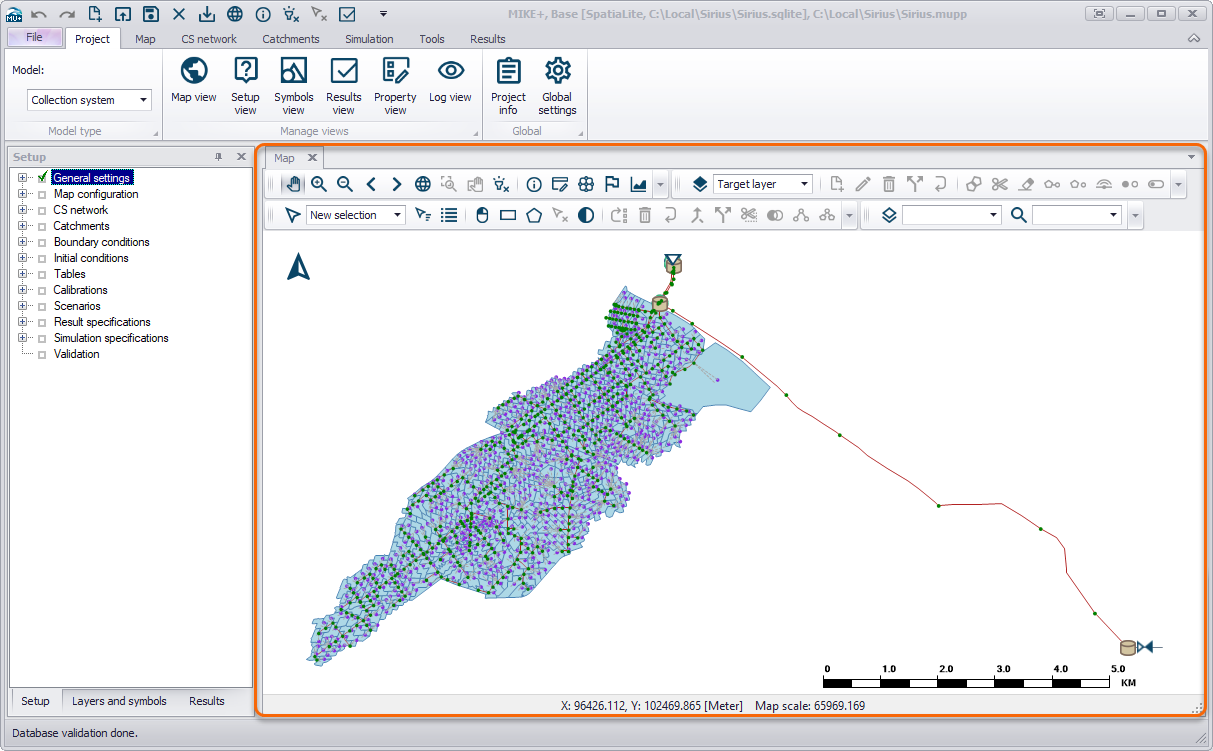
Figure: Map view of the model with default symbology
The map is per default “docked” but can be “floated” (right “click” on the tab heading + Float). The map can be brought into view by clicking on the “Map” tab or the “Map View” button on the Project menu ribbon.