Viewing Locations of Online Analysis Data on the Map
To visualise the location of selected sensors, controls, or comparison points on the Map, select them from their respective editors, and then use the special selection 'Network items associated to selected SCADA data' from the Map tab in the ribbon. This will select the model elements (nodes or links) where the selected sensors, controls, or comparison points are defined.
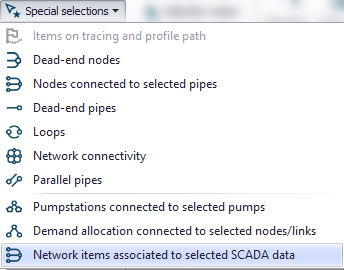
Figure: Selecting network items associated to selected SCADA data