Statistics and Redistribution
MIKE+ can generate statistical information for junction node demands. Demand statistics can be computed for each pressure zone as well as for the complete network. Additionally, this editor allows the user to redistribute node demands by changing the calculated statistical results.
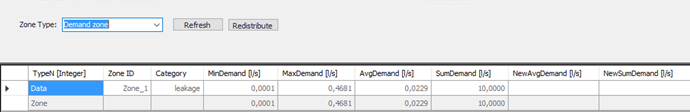
Figure: Statistics and redistribution
When the average demand for the 'Total zones' and the 'Entire network' are different, the corresponding values will be highlighted in the table. This can indicate that some parts of the network are included in multiple zones, or that some are not included in any zone. Users should investigate the cause of this difference, and check if the result is acceptable or not. Having parts of the network included in multiple zones may e.g. be a problem while redistributing the demand.
A list of the Statistics information follows, with a brief description given for each item.
- Show: This list located above the table controls whether the table show data for zones with a 'Network' definition type only, for zones with a 'Selection' definition type only, or for the entire network.
- Type: The 'Type' list above the table controls the type of data shown in the table:
- When showing network zones, the type controls whether the table processes links (i.e. pipes, pumps, valves and turbines) or nodes (junctions, tanks and air-chambers)
- When showing selection-based zones, the type controls the type of zone (DMA zone, pressure zone, demand zone, region zone, ward, other).
- Statistics period: Statistics shown in the table are computed for the settings (especially Start and End times) defined in the active simulation, in the 'Simulation setup' editor. These simulations settings are shown in the 'Statistics period' group, for clarity.
- TypeN: This column in the table is used to distinguish between data (demand statistics for the selected category), zone (demand statistics for pressure zone), and network (demand statistics for the whole network).
- Zone: Zone ID identifies the zone for which the demand statistics is generated.
- Category: This column identifies the category within the current pressure zone for which the demand statistics is generated.
- Minimum Demand: This column represents the minimum demand per category per zone. The minimum demand is calculated as minimum demand at junction nodes at specific time level.
- Maximum Demand: This column represents the maximum demand per category per zone. The maximum demand is calculated as maximum demand at junction nodes
- Average Demand: This column represents the average demand per category per zone. The average demand is calculated as average demand at junction nodes during the entire simulation.
- Sum Demand: This column represents the total demand per category per zone. The total demand is calculated as total demand at junction nodes during the entire simulation period.
- New Average Demand: This column allows to input the new total demand for selected category, zone or a network. All corresponding junction node demands will automatically be adjusted (scaled) in order to fit the new total demand value.
- New Sum Demand: This column allows to input the new total demand for selected category, zone, or a network. All corresponding junction node demands will automatically be adjusted (scaled) in order to fit the new total demand value.
The following buttons are used to edit the content of the statistics table:
- Refresh: this button re-generates (updates) the demand statistics.
- Redistribute: this button redistributes node demands based on the new values of Average or Total demand (zone or network). This powerful feature provides the user with the option of specifying the new zone or a network demand from within the Demand Statistics window and redistribute the node demand accordingly. The process of the demand distribution is based on using the existing node demands as coefficients - weights to calculate the new demand values.