Introduction to Results Presentation
With MIKE+ you can present your results in a number of ways:
- Maps (see Displaying Results on a Map)
- Time series plots (see Time Series Plot)
- Tables (see Results Table)
- Profile plots (see Profile Plots)
- Cross section plots (see Cross section Plots)
- Bar charts (see Bar Chart)
- Q-H plots (see Pump Q-H Plot and Hydrant Q-H Plot)
- Scatter plots (see Scatter Plot)
- Calibration and statistics (see Calibration Plots and Reports)
When working with time-varying results, all these results presentation windows are always synchronized to show results from the same date and time. See Animations for more information.
You can visualize results with an active project, which allows visualizing both input model data and results at the same time. MIKE+ can also be used for standalone results viewing, i.e. without any opened project / database. To achieve this, simply open MIKE+ and then open the Results panel to load result files.
Before displaying results, result files must first be loaded in MIKE+, in the 'Results' tree. Results are, by default, automatically loaded into the MIKE+ project after a simulation. They can however be added manually using the 'Add file' buttons in the 'Results' tree or in the ribbon.
Note
The automatic loading of simulation results may be disabled via the User preferences dialog.
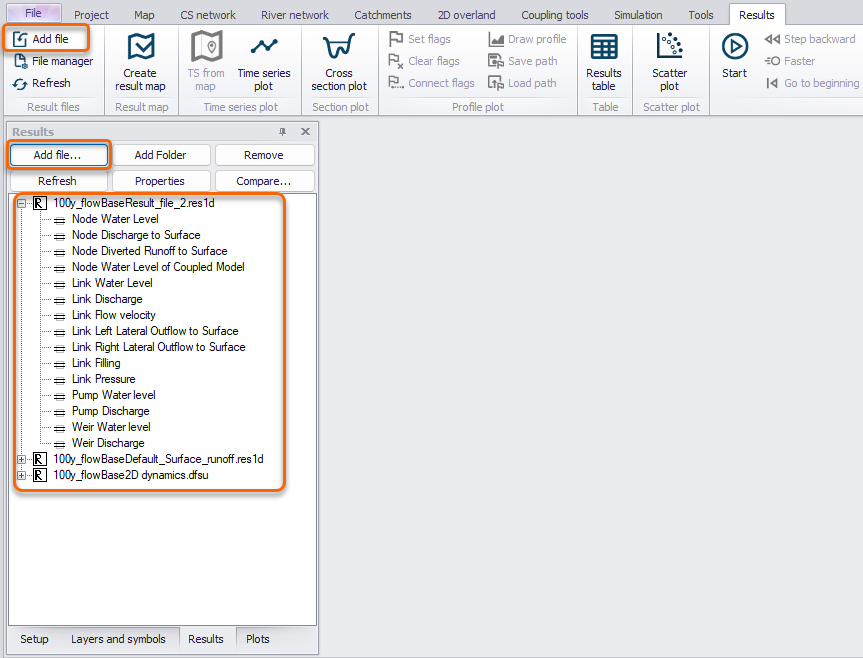
Figure: The list of loaded result files and the 'Add file...' buttons
When loading a result file, a dialog appears with options to control the content to load into memory:
- Time period to load: this can be used to ignore parts of the simulation period, e.g. to limit memory usage for large result files, or to ignore an initial period which is influenced by inaccurate initial conditions of the simulation. This is only available for 1D result files.
- Step every: this is the time step frequency to load, which can be used to skip some time steps during loading to limit memory usage for large result files. This is only available for 1D result files.
- Data items to load: selection of result items which should be loaded in the project. This list is a combination of result items saved in the result file (which can be selected from the Result files editor before running the simulation, for MIKE1D and 2D results), and derived results which are computed in memory. See Result files for description of derived items for MIKE1D results, and Output for description of derived items for Water Distribution results. For 2D results, all result items in the file are always loaded.
- Items to plot on map: selection of result items to show on the model map while loading the file. This option is only available when a project database is opened. Result layers can alternatively be added later to the map from the 'Layers and symbols' tree.
Press 'OK' to finish loading result files items. Only the loaded data will later be available and visible in the results presentation windows.
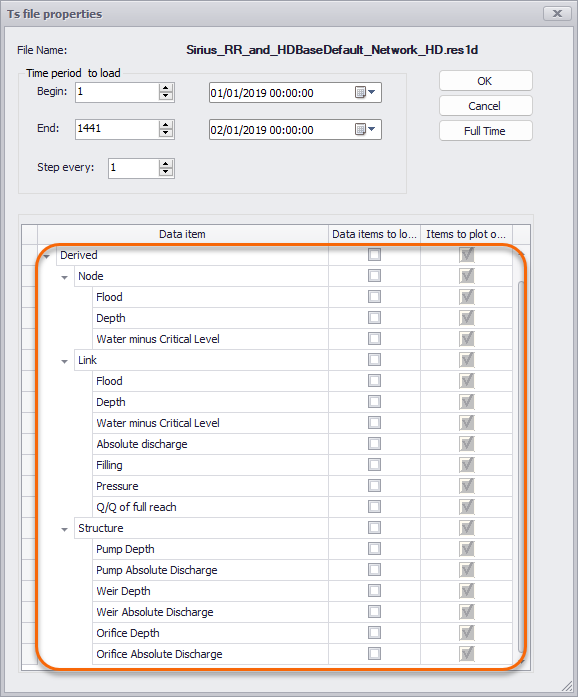
Figure: Example of the result file data selection dialog
The following result file types are supported in MIKE+:
- From Collection System and River simulations:
- res1D files (network or catchment results varying in time and space)
- dfs0 files (time series)
- From 2D Overland simulations:
- dfs0 files (time series)
- dfsu files (surface results varying in time and space on a flexible mesh)
- dfs2 files (surface results varying in time and space on a rectangular grid)
- From SWMM simulations:
- .out files (network and catchment results varying in time and space)
- From Water Distribution simulations:
- .res files (standard hydraulic and water quality results)
- .resx files (extended hydraulic results)
- .whr files (water hammer results)
- .whrx files (extended water hammer results)
- .msxr files (multi-species water quality results)
- .csv files (fire flow, network vulnerability and flushing analysis results). The *.csv file is a comma-separated text file which can also be opened in other editors like Microsoft Excel, if necessary.
Note
SWMM and Water Distribution result files don't store the network geometry (pipe connectivity, levels, etc.). When opening these results files in MIKE+ without opening a project (database), it is therefore recommended to keep the *.inp simulation file created with the result file, from which this network geometry can be retrieved, otherwise some results viewing functionalities are disabled (showing result map layers and profile plots).
Once result files are loaded, result presentation tools are accessed via the local context menu (i.e. right-click) on the file names in the 'Results' panel, as well as from the Results ribbon.