Network vulnerability
Network vulnerability modelling is required to predict the water distribution system response to pipe breaks situations, planned reconstructions, and other scenarios of limited water supply. Network vulnerability allows also the develop a pipe ranking based on the importance for the water supply and such importance can be then taken into account for the planning of pipe rehabilitation and reconstructions.
Network vulnerability criteria
The Todini Index
The Todini index is a system relative aggregated measure defining how close a water distribution network operates compared to its minimum required level.
The Todini index (TI) is defined as:
(13.1) 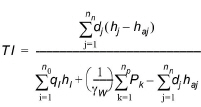
where:
- \(n_{n}\) is the number of nodes in the network
- \(d_{j}\) is the demand at node j
- \(h_{j}\) is the hydraulic head at node j
- \(h_{aj}\) is the required minimum hydraulic head at node j
- \(n_{0}\) is the number of reservoirs in the systems
- \(q_{i}\) is the outflow from reservoir i
- \(h_{i}\) is the hydraulic head at reservoir I
- np is the number of pumps in the network
- \(P_{k}\) is the power of pump k
- \(g_{w}\) is the water specific weight.
The Todini index is computed at a given time level. When computing it for an extended period simulation, the reported index value is the average of the Todini index computed at each time level.
The Connectivity Index
The Connectivity Index is the probability that all nodes in the system are connected to at least one source.
The Node reachability Index
The Reachability Index is the probability that a given node in the system is connected to at least one source.
The Pipe criticality Index
The pipe criticality is determined based on evaluation of several performance indicators including:
- Pipe flow criteria (PI-1)
- Service pressure criteria (PI-2)
- Water demand criteria (PI-3)
- Pipe length criteria (PI-4)
- User defined criteria (PI-5).
The combined pipe criticality is computed as an average of all above performance indicators, i.e.
\(C_{\text{pipe } i} = \text{Average}(P1+P2+P3+P4)_{\text{pipe } i}\), where
- Pipe flow criteria (P1) is computed as water (in flow units) that cannot be delivered through the pipe. The value of 1 corresponds to the total flow.
- Service pressure criteria (P2) is computed as number of nodes, where the service pressure is below the required level e.g. 15 m or 20 psi, for example. The value of 1 corresponds to the total number of nodes.
- Water demand criteria (P3) is computed as the value of total water demand that cannot be delivered in nodes due to insufficient service pressure. The value of 1 corresponds to the total water demand consumption.
- Pipe length criteria (P4) is computed as a total length of pipes where the pressure is below the required service level. The value of 1 corresponds to the total pipe length. Similarly, it is possible to use the number of population disconnected from the water supply or number of disconnected residences or houses.
- P5 is computed as a total (sum of) “criteria” of pipes where the pressure is below the required service level.
User defined performance indicator P5 can be used by selecting any numerical field that is defined in the Pipe editor. If the pipe demand coefficient 1, for example, contains values corresponding to the number of connected customers then the P5 indicator will report number of connected users that are affected by the particular pipe unavailability.
The user defined performance indicator “P5” is an optional parameter and it is therefore not included in the combined indicator “C” where only default indicators P1, P2, P3, and P4 are accounted for.
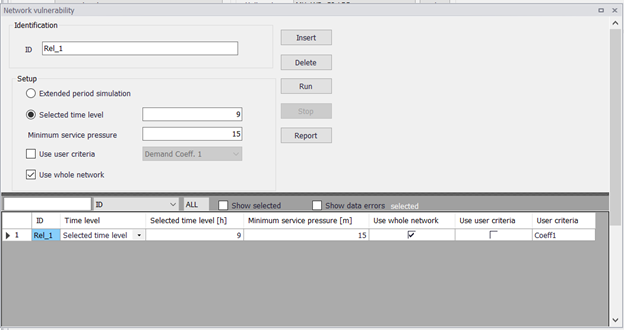
Figure: Network vulnerability defined criteria
Selected time level is entered in hours or a fraction of hours from the simulation start, e.g. entering "9" will run the network vulnerability at 9 AM for the simulation start at 12 AM.
Select “Use user defined criteria:” and then select the pipe field that holds the data used for the criteria evaluation, e.g. “Demand coefficient 1” in case that you want to include only such pipes in the analysis.
The 'Network vulnerability' editor
The 'Network vulnerability' editor is available after activating the 'Network vulnerability' option in the ‘Model type’ editor.
A list of the 'Network vulnerability' attributes follows, with a short description given for each one.
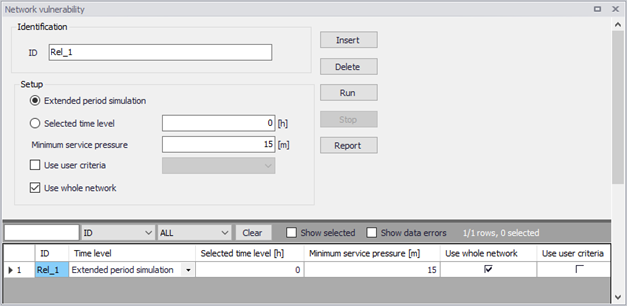
Figure: The Network vulnerability editor
- Selected time level: This data entry allows you to select the time level from the extended period simulation that will be used to compute the network vulnerability
- Extended period simulation: This data entry allows you to compute the network vulnerability for all time levels i.e. for the entire duration of the extended period simulation. Please note, that this option may lead to extensive simulation times. If this option is selected, the performance indicators PI1-PI4 will be based in results over the entire simulation and may, for example, contain results of water demand deficiencies caused by storage tanks that were drained due to closed pipes.
- Minimum service pressure: This data entry specifies then minimum acceptable service pressure within the network e.g. 15 m or 20 psi that is required for uninterrupted water supply
- Use whole network: This data entry allows you to run the network vulnerability for all pipes within the model or for pipes within selected pressure zone(s).
Running simulations
Click the 'Run' button from within the 'Network vulnerability' editor in order to run the simulation. The simulation progress will be displayed in the application status window. The simulation can be interrupted (cancelled) by pressing the Esc key.
Network Vulnerability Results
Results of the network vulnerability simulations can be displayed in different ways. They are saved in a .CSV file, which is a comma separated text file in a format that is suitable for importing into Microsoft Excel, for example.
Tabular results
The simulated pipe criticality results file can be displayed in a results table.
The tabular results can also be displayed directly from within the 'Network vulnerability' editor using the 'Report' button.
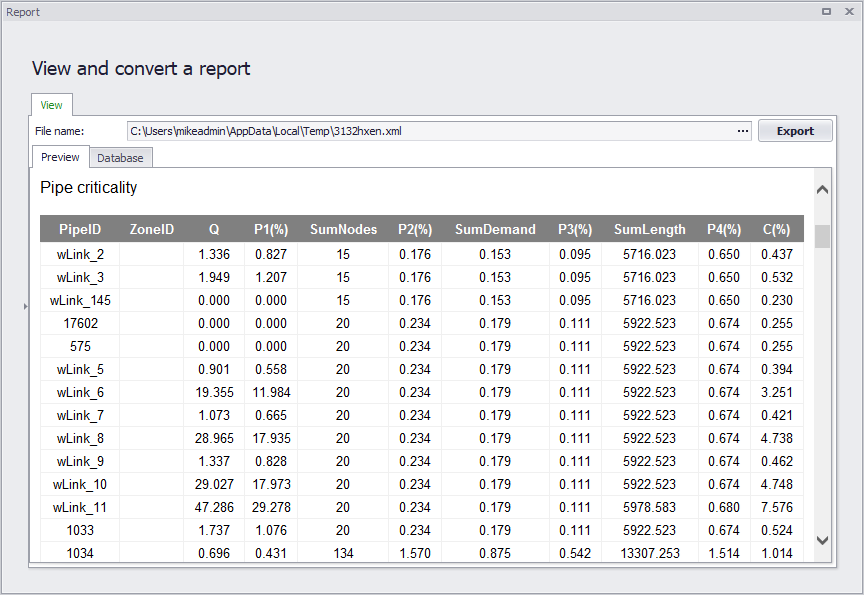
Figure: Example Network vulnerability report
Thematic maps
The simulated network vulnerability results can be displayed using the colour coded maps.
List of available network vulnerability result items:
- Q: flow per pipe that was not delivered (flow units or volume units in case of extended period simulation for all time levels)
- P1: performance indicator P1 (-)
- SumNodes: number of nodes where the service pressure is insufficient
- P2: performance indicator P2 (-)
- SumDemand: demand or total water volume in case of extended period simulation for all time levels)
- P3: performance indicator P3 (-)
- SumLength: total pipe length where the service pressure is insufficient
- P4: performance indicator P4 (-)
- C: performance indicator C (-).
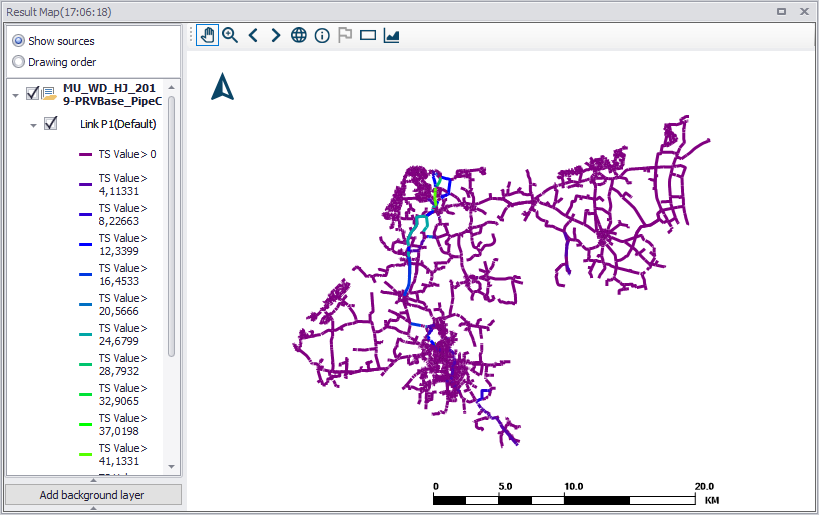
Figure: Example Network vulnerability map result showing Link P1 results