LID Deployment
The LIDs are assigned to a catchment by means of the LID Deployment Editor. In this Editor, it is possible to specify the size (i.e. area) of the individual LID structure, the size of the catchment´s impervious area that is funnelled into it and the number of the current LID units.
The size properties can be specified either directly as surface area, or as a percentage of the catchment's area. The specified total collecting area must not exceed the size of the catchment's impervious area.
Furthermore, level of initial saturation and routing width for overland flow can be specified.
The input data is organized into the following groups:
- Identification
- Deployment Parameters
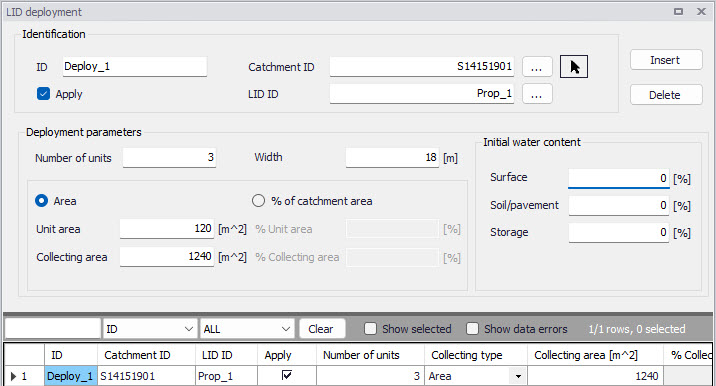
Figure: The LID Deployment editor
Identification
Each deployed LID is linked to a LID Deployment ID. I.e. each deployment represents a LID deployed on a single catchment in a specified number of units. For each LID deployment, a result file can be generated containing time series of relevant variables (fluxes and storages). This result file is in the DFS0 time series format.
A full reference of the attributes related to LID deployment in shown in the tables below.
| Edit Field | Description | Used or required by simulations | Field name in data structure |
|---|---|---|---|
| ID | Unique deployment ID | Yes | MUID |
| Catchment ID | Identification of the associated catchment | Yes | CatchID |
| LID ID | Identification of the LID structure to be deployed | Yes | LidID |
| Apply checkbox | Option for activating/deactivating deployment of a LID structure | Yes | IncludeNo |
Table: The LID Deployment Identification Group (Table msm_LIDusage)
Including or excluding a LID is handled by the Active checkbox.
Deployment Parameters
| Edit Field | Description | Used or required by simulations | Field name in datastructure |
|---|---|---|---|
| Number of Units | Number of replicate LID units deployed within the catchment | Yes | ReplicateNumber |
| Width | The width of the outflow face of each identical LID unit (meter or feet). This parameter is applied for all control units that use overland flow to transport surface runoff off the unit, being these roofs, pavement, trenches, and swales for the other control types this parameter can be set as 0 | Yes (for porous pavement, swales, roofs and trenches) | Width |
| Area/% of Catchment Area options | Toggle for LID collecting area setting | Yes | CollectingNo |
| Unit Area | The surface area of each replicate LID unit | Yes If CollectingNo=Area | UnitArea |
| Collecting Area | A LID practice is connected to a tributary area whose runoff is treated by the unit. This area includes the LID practice area itself. | Yes If CollectingNo=Area | CollectingArea |
| % Unit Area | The surface area of each replicate LID unit, expressed as a percentage of the total catchment area | Yes If CollectingNo=% of Catchment Area | UnitAreaPercent |
| % Collecting Area | The tributary area connected to the LID unit presented as a percentage of the catchment | Yes If CollectingNo=% of Catchment Area | CollectingAreaPercent |
| Surface | Initial water content of the surface layer | Yes | InitSatSurface |
| Soil/Pavement | The degree to which the unit´s soil is initially filled with water (0% saturation corresponds to the wilting point moisture. | Yes | InitSatSoil |
| Storage | Initial water content of the storage layer. | Yes | InitSatStorage |
Table: The LID Deployment Properties (Table msm_LIDusage)
LID Deployment Result File
Optionally, for each LID structure deployment, a DFS0 time series file can be created. This file includes time series of relevant variables inside the LID structure in terms of inflow, flow between layers, storage levels in various layers and output from the structure to the native soil.
If the User does not activate this option, the only visible outputs from the runoff simulation including LIDs are the changed (reduced) runoff hydrographs, caused by infiltration loss and storage in the LID structure, and the LID summary table in the simulation summary file.
The contents of the DFS0 file depends on the actual LID type. In the figure below, an example of the DFS0 file for porous pavement is presented. Thirteen columns contain time series for the processes occurring inside the porous pavement.
Note
The flow inside the LID structure and the drain flow are reported as intensities based on the LID area. In cases where the collecting area is bigger than the LID area, the reported intensities will not be comparable with rainfall and evapotranspiration intensities, which are given as the model boundary conditions. In order to make the comparison possible, the reported flow intensities must be scaled down by the ratio between the LID area and the collecting area.
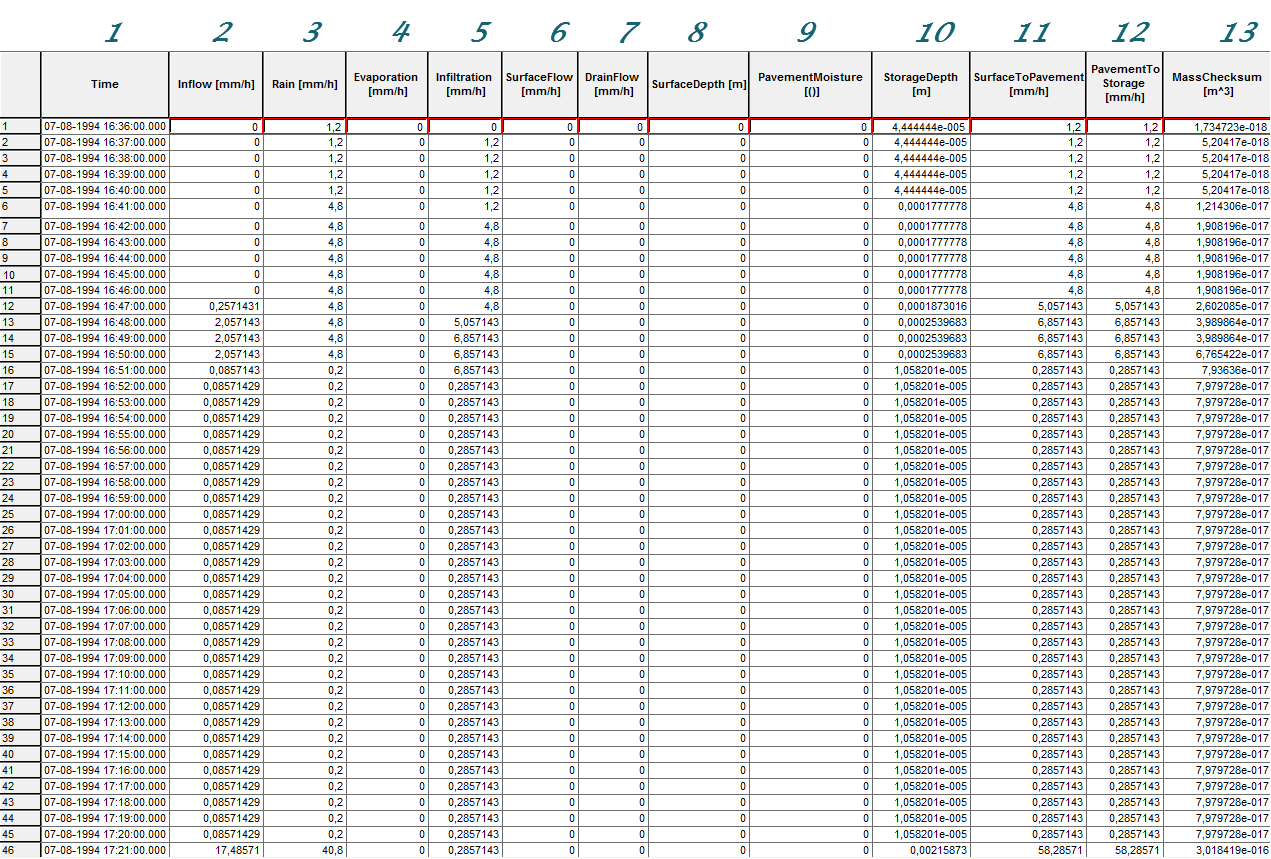
Figure: Example of a result report DFS0 file per deployment (a porous pavement control)
-
Time: calendar time for the simulated time steps.
-
Inflow (mm/h): inflow to the LID unit given as a multiple of the rain intensity and the collecting area outside LID/LID area. It is the run-on from the collecting area outside the LID and rain on top of the LID unit. The run on represents the net rain on the impervious collecting area, i.e. with initial losses subtracted.
-
Rain (mm/h): input rain for the catchment containing the LID unit. This rain loads the LID area directly.
-
Evaporation (mm/h): this is a given parameter specified by the User by means of boundary conditions valid for the catchment as well as for the LID unit.
-
Infiltration (mm/h): infiltration from the LID unit to the surrounding native soil.
-
Surface flow (mm/h): surface water flow. Represents overland flow for vegetative swale; overflow for other LID controls
-
Drain flow (mm/h): water flow through the drain.
-
Surface depth (m): accumulated water on the surface expressed as the water height on the surface. Maximum value is the specified surface storage height.
-
Soil moisture (): presented as a fraction, relative to the total volume of the soil layer. Corresponds to the water that is held in the spaces between soil particles. Maximum soil moisture (i.e. full saturation) is equivalent to the specified soil porosity.
-
Pavement moisture(): presented as a fraction, relative to the total volume of the porous pavement layer. Corresponds to the water that is held in the pavement's voids. Maximum pavement moisture (i.e. full saturation) is equivalent to the specified pavement porosity.
-
Storage depth (m): accumulated water in the storage layer expressed as the water height in the storage. Maximum value is the storage height.
-
Surface to soil (mm/h): infiltration from the surface layer to the soil layer expressed in mm/h.
-
Surface to pavement (mm/h): infiltration from the surface layer to the pavement layer expressed in mm/h.
-
Soil to storage (mm/h): ): flow from the soil layer to the storage layer expressed in mm/h.
-
Pavement to storage (mm/h): flow from the pavement layer to the storage layer mm/h.
-
MassChecksum (\(\text{m}^{3}\)): regards to the error check in the mass water balance per time step computed, a low value in the order of 1*E-015 indicates an accurate internal flow estimation.
LID Simulation Summary
The LID simulation summary is provided as part of the overall simulation summary HTML file. The summary table reports the volume balance for each LID deployment (see example in figure below).
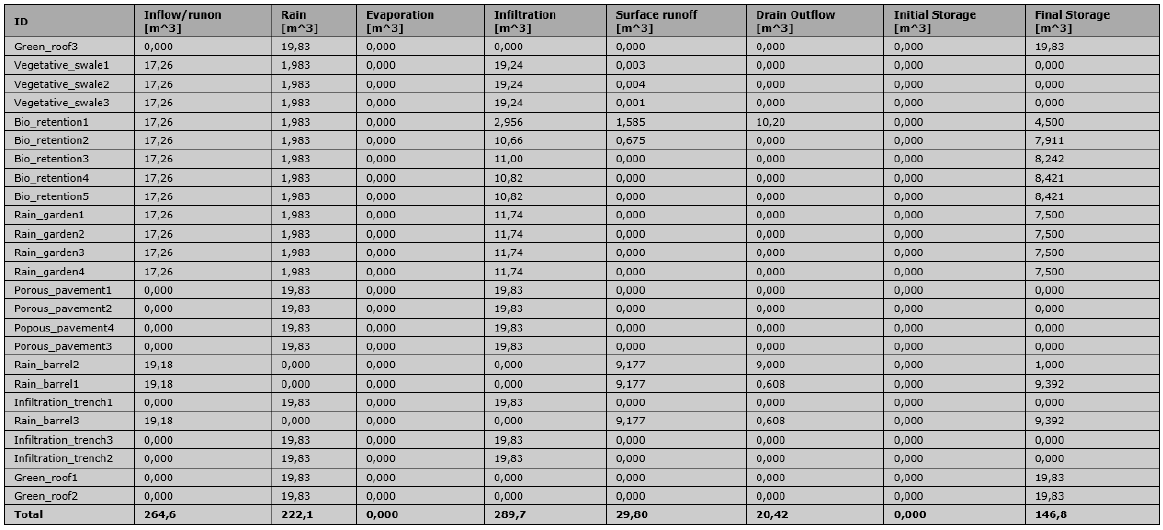
Figure: Example of a LID simulation summary