Alarms and Violations
The Alarms and Violations tool provides a way to impose user-defined checks for Water Distribution model results. It allows for quick examination of the performance of elements that are important to the WD system, or of particular interest to the user.
Launch the Alarms and Violations tool from the 'Results' tab of the ribbon. The tool is only available for Water Distribution models.

Alarms and violations allows definition of critical values for various result items anywhere within the model network, such as maximum velocity, minimum or maximum pressure, low or high level, and high water age, and let the hydraulic model evaluate them based on the actual simulation results.
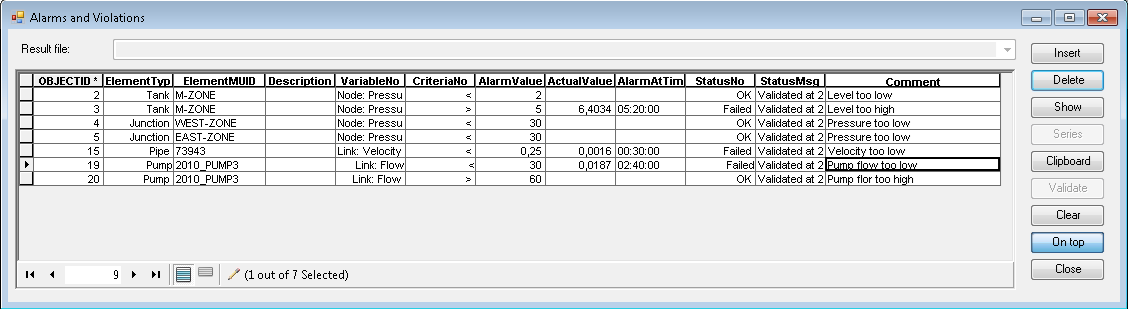
Figure: The Alarms and Violations dialog
The dialog contains a table allowing to define or display the following parameters:
- Element Type: Select from the following types:
- Junction
- Tank
- Pipe
- Pump
- Valve
- Element ID: The MUID of the element. Use a ‘*’ to apply the criterion to all elements of a selected type.
- Description: Optional user-defined description
- Variable No: Select the result item from available items according to element type.
- Criteria: Basic math operator (i.e. <, <=, =, etc.) for building the criterion.
- Alarm Value: Set the critical (alarm) value.
- Actual Value: Validation result showing the highest or lowest of the actual values resulting in the alarm.
- Alarm at Time: Validation result showing the time of the simulation corresponding to the "Actual value".
- Status: Status of the validation, "OK" (No violations) or "Failed" (With violations).
- Status Message: Information on the results validation (i.e. Date/time of validation)
- Comment: User-defined comment
Note
The alarm will be triggered if the criterion is fulfilled i.e. if the criterion is defined for a "Tank level < 2" then the alarm will be reported once the computed level is below "2".
The following buttons are also available:
- Insert: Adds a new record to the table.
- Delete: Deletes the highlighted record from the table.
- Highlight: Highlight specified elements on the Map.
- Clear highlight: Removes highlight of specified elements on the Map.
- TS plot: Displays the result time series for the selected alarm item. A tabular view of the time series results is also available from the TS Plot window.
- Clipboard: Copies the content of the table into a clipboard.
- Validate: Performs the results validation for the selected results file.
- Clear: Clear results from the last validation.
- Duplicate: Makes a copy of a selected alarm setup record.
Note
The above mechanism allows you to define certain checks for specific locations (e.g. junctions and pipes), as well as for all locations when the ‘*’ is used instead of the MUID for the Network ID column.
For example, the criterion "Junction * pressure > 100" will map all junction nodes where the pressure was more than 100 during the simulation.
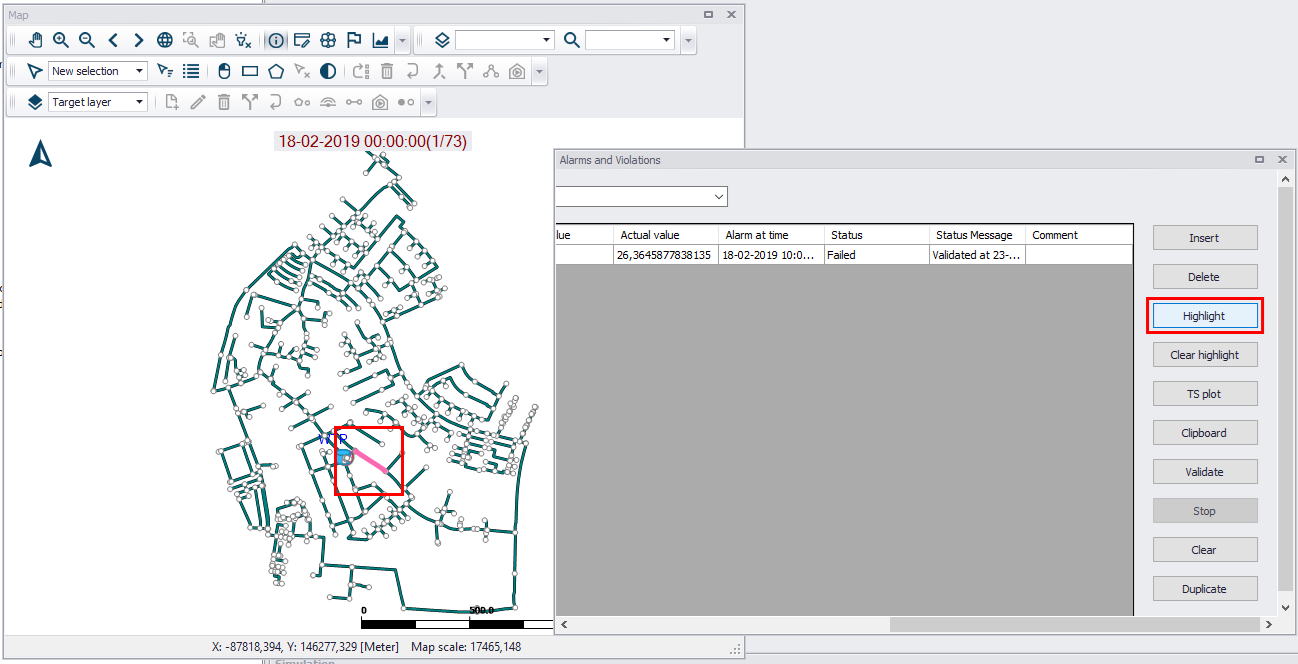
Figure: Highlight elements on the map using the ‘Highlight’ button on the dialog
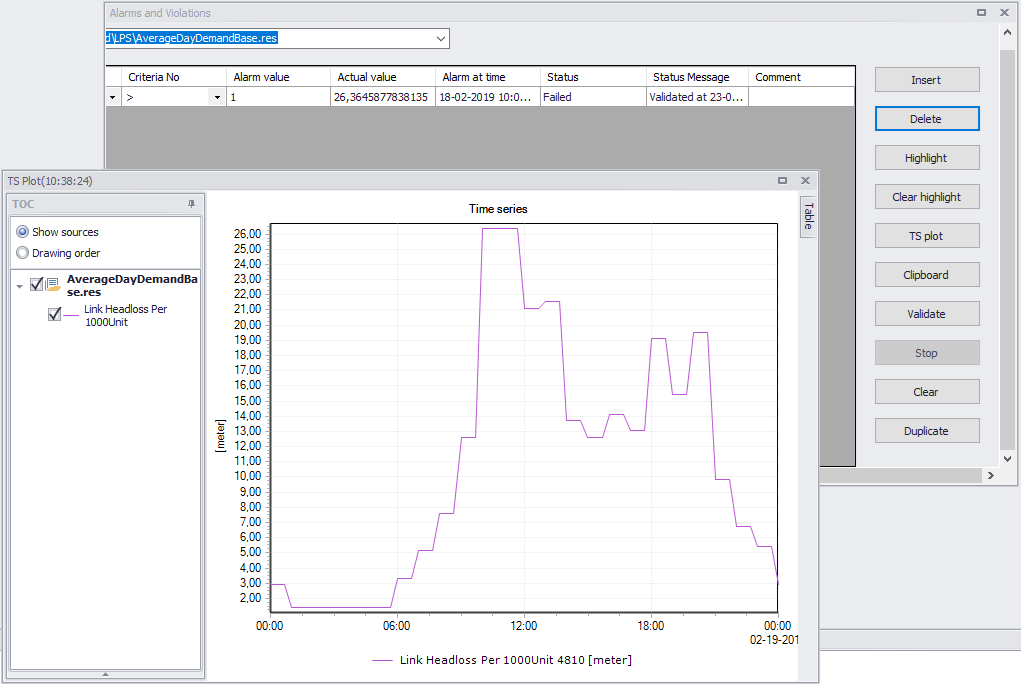
Figure: Example time series plot generated from the ‘TS plot’ button on the dialog
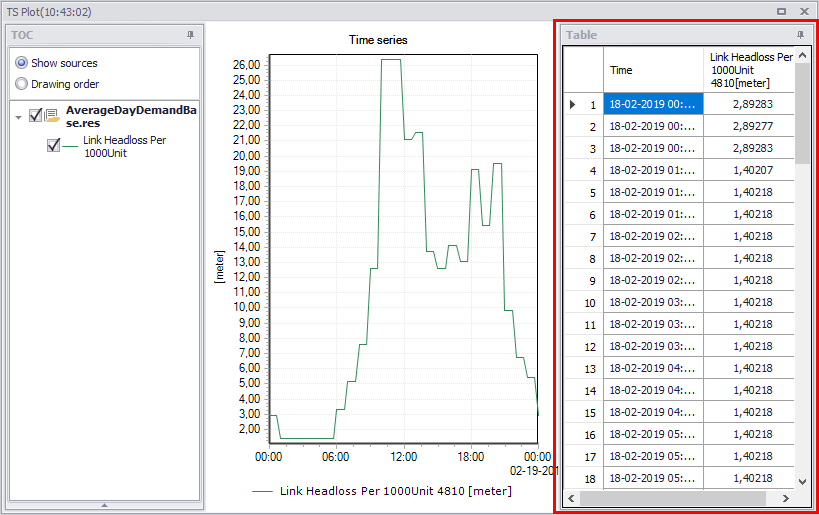
Figure: A tabular view of time series results is also available from the TS Plot window