Displaying Extreme Events Statistics on the Map
MIKE+ can present the following results as layers on the map:
- Maximum water level exceedance in nodes and grid points for specified recurrence intervals. The values are presented in all nodes and grid points where "Max water level" statistics are available. Results in nodes are shown as point symbols, and results in grid points as line symbols.
- Maximum discharge exceedance in grid points, weirs, pumps, orifices and valves for specified recurrence intervals. The values are presented in all locations where max. discharge statistics are available. Results are shown as line symbols.
- Recurrence interval for Maximum water level exceedance of ground level in nodes and grid points. The recurrence interval is calculated similarly as in the previous section (i.e. by linear interpolation). The values are presented in all nodes and grid points where "Max water level" statistics are available. Ground levels for nodes are taken from node data. Ground levels for grid points are interpolated from the neighboring nodes. Results are shown as point symbols at nodes. The user can control the colouring and size of the symbols.
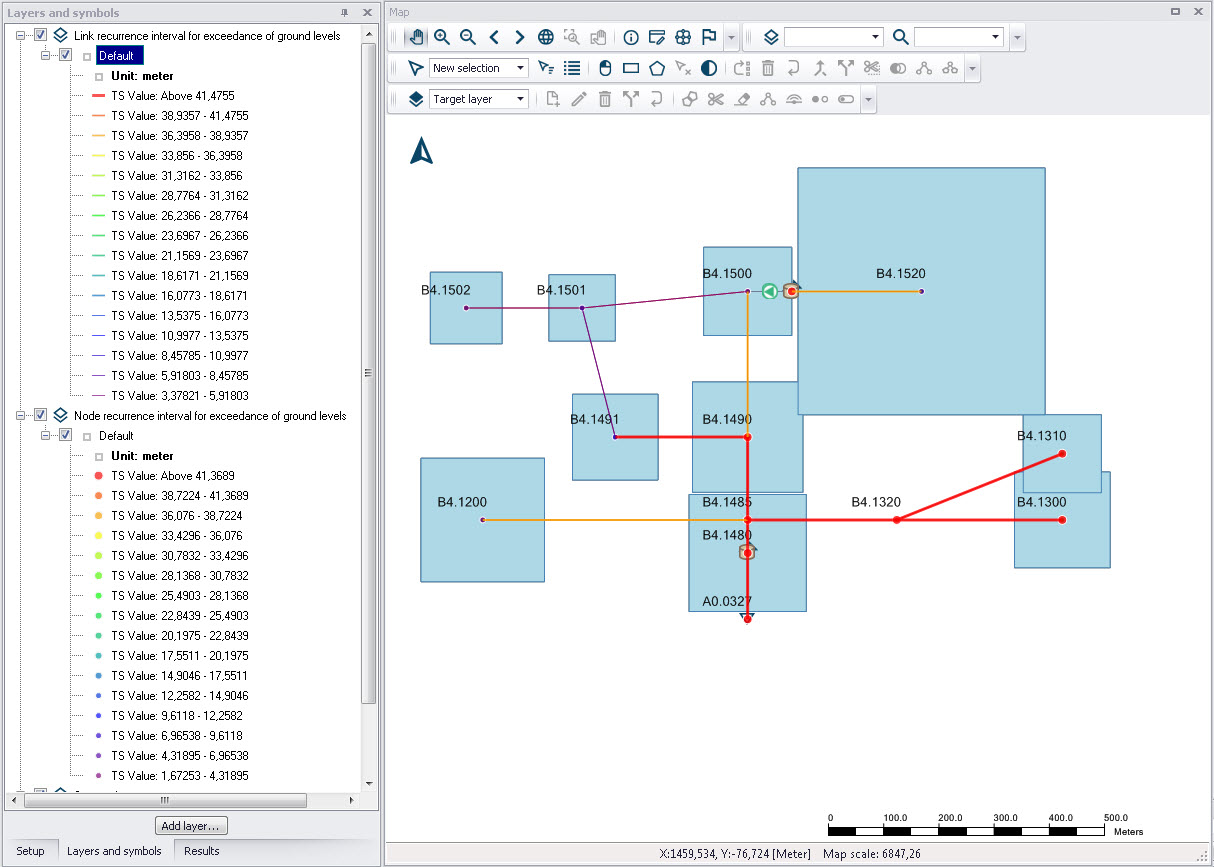
Figure: Example maximum node and link water level exceedance recurrence interval plot on the Map
- Recurrence interval for Maximum water level exceedance of critical level in nodes. The recurrence interval is calculated similarly as described in the previous section (i.e. by linear interpolation). The values are presented in all nodes where "Max water level" statistics and "Critical level" data are available. Critical levels for nodes are taken from the node data in the LTS result file.
- Recurrence interval for Maximum flow exceedance of Manning discharge (i.e. full-flow discharge) in grid points. The recurrence interval is calculated similarly as described in the previous section (by linear interpolation). The values are presented in all grid points where "Max flow" statistics are available. Manning discharge for grid points (i.e. for links) are taken from the link data in the LTS result file.