Displaying Extreme Events Statistics in Profiles Plots
Recurrence intervals of exceedance for selected variables may be displayed along a longitudinal profile.
The example below shows exceedance values for link water levels along a profile for recurrence intervals 1, 3, 10 and 20 years. These are static values and cannot be animated.
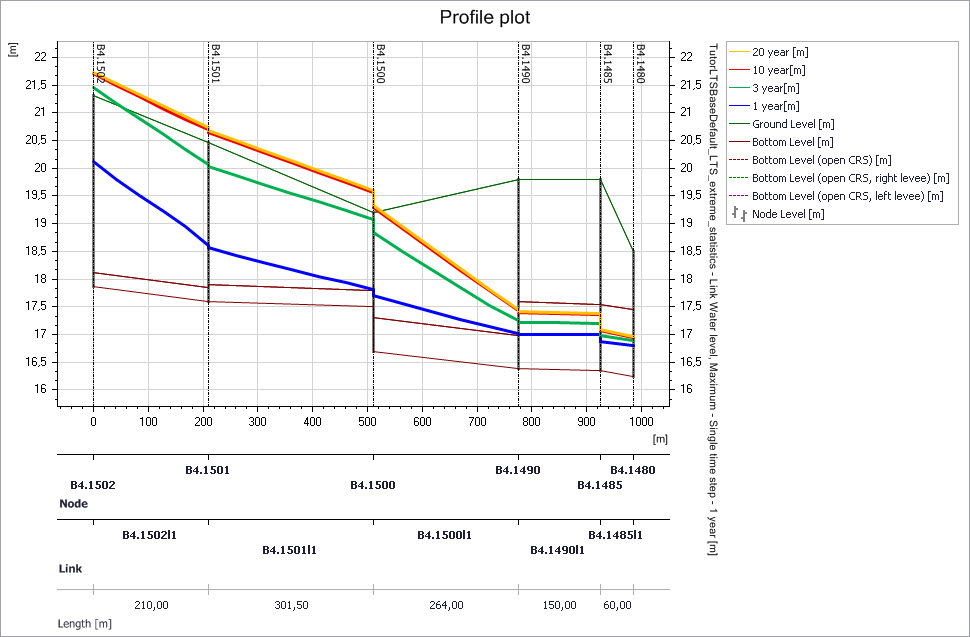
Figure: Example of link water level exceedance intervals plotted along a longitudinal profile
Exceedance values for the following variables are available for plotting along a profile:
- Maximum water level (grid points and nodes)
- Max flow (grid points, pumps, orifices, weirs, valves)
- Max velocity (grid points)
- Max concentration (grid points, pumps, orifices, weirs, valves, nodes)
After selecting the wanted variable, the exceedance values for the specified frequency are plotted for all model elements along the profile where extreme statistics are available. Intermediate values between two neighboring available values are linearly interpolated.