Generating Reports on LTS Statistics
MIKE+ generates LTS statistics reports for the following:
- Summary report on extreme events statistics: This report contains tables summarizing all calculated statistics in the file, i.e. for all individual locations, variables and statistics types. Can be generated only for result files with LTS extreme events statistics.
- Detailed report on extreme events statistics: This report contains tables detailing all calculated statistics in the file, i.e. for all individual locations, variables and statistics types. Can be generated only for result files with LTS extreme events statistics.
- Report on chronological (yearly/monthly) statistics: This report shall contain tables with all calculated yearly/monthly statistics for all individual locations and variables (volumes, accumulated mass, durations, number of events). Can only be generated for Chronological results (with yearly/monthly statistics).
Summary report on extreme events statistics
This report includes some or all of the tables listed below. The tables included depend on the actual contents of the LTS result file and user selection.
The following fields (columns) are included in the tables:
- MUID: Location ID (always)
- Position: Distance of the grid point from upstream node (Optional, only for location type = Link)
- GL: Node ground level (Optional, only for some types of statistics in nodes)
- T_GL: Recurrence interval for exceedance of node ground level (Optional, only for some types of statistics in nodes)
- H_crit: Node critical level (Optional, only for some types of statistics in nodes)
- T_Hcrit: Recurrence interval for exceedance of node critical level (Optional, only for some types of statistics in nodes)
- Q_full: Link's full-flowing Q (Manning Q) (Optional, only for discharge statistics in links)
- T_Qfull: Recurrence interval for exceedance of link's Q_full (Optional, only for discharge statistics in links)
- T_spill: Recurrence interval for occurrence of spill in a spilling node (Optional, only for some types of statistics in spilling nodes)
- T_surcharge: Recurrence interval for occurrence of surcharge in nodes (Optional, only for some types of statistics in spilling nodes)
- 1year: Exceedance of variable value for recurrence interval 1 year (For LTS simulations longer than 1 year)
- 2year: Exceedance of variable value for recurrence interval 2 years (For LTS simulations longer than 2 years)
- 5year: Exceedance of variable value for recurrence interval 5 years (For LTS simulations longer than 5 years)
- 10year: Exceedance of variable value for recurrence interval 10 years (For LTS simulations longer than 10 years)
- 20year: Exceedance of variable value for recurrence interval 20 years (For LTS simulations longer than 20 years)
- 50year: Exceedance of variable value for recurrence interval 50 years (For LTS simulations longer than 50 years)
- 100year: Exceedance of variable value for recurrence interval 100 years (For LTS simulations longer than 100 years)
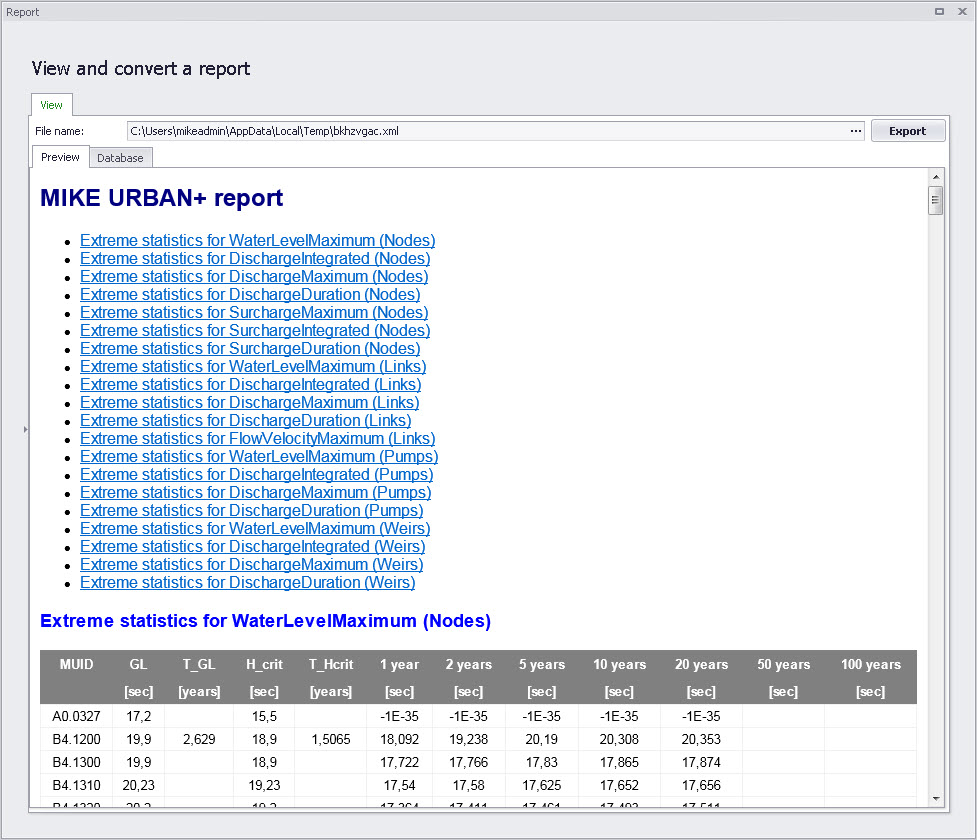
Figure: Example report on extreme statistics for water level in nodes
Detailed report on extreme events statistics
This report provides full detail of all extreme events statistics available in the LTS result file. The total number of tables corresponds to the number of available statistics types multiplied by the actual number of locations for each type of statistics.
The header of the report document has a list of hyperlinks for available statistics.
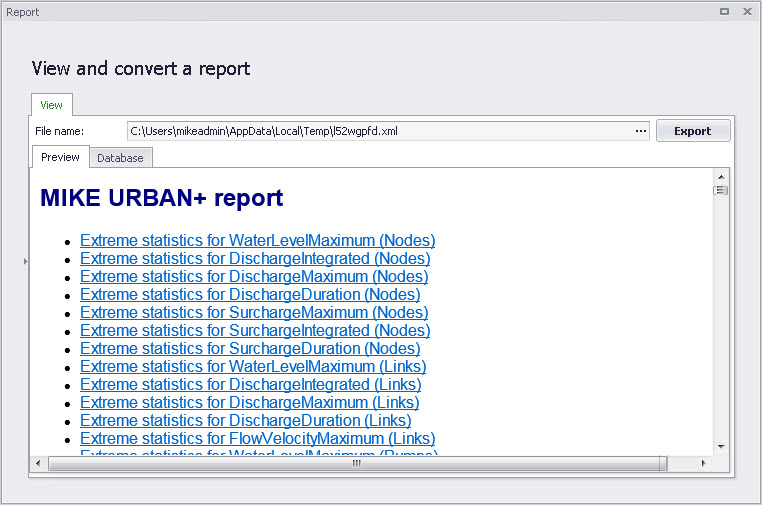
Figure: Report header hyperlinks
Report on chronological yearly monthly statistics
Report on chronological (yearly/monthly) statistics
This report includes tables according to the actual contents of the LTS chronological (yearly/monthly) statistics result file and user selections.
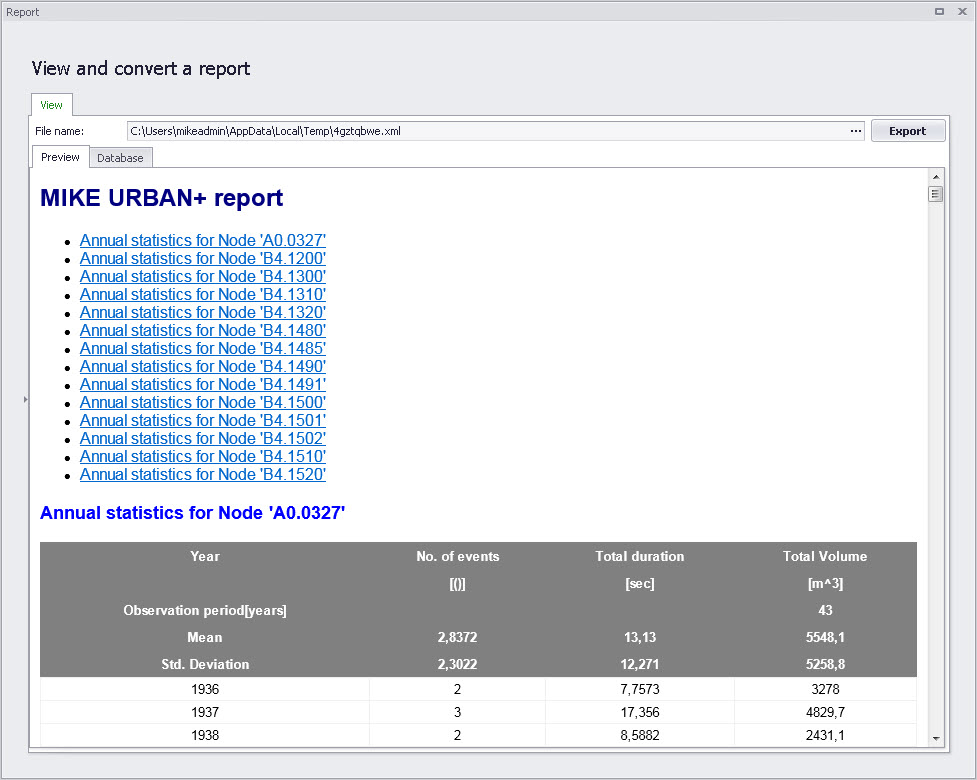
Figure: Report on chronological statistics
The number of tables in the report is a multiple of the number of included (and selected) table types and locations.
The following fields are included in the tables:
- Year: (Always) Actual year. The first row in the table contains the first year of simulation, and the last row contains the last year of the simulation. Intermediate rows contain the simulated years in growing order.
- Month: (Optional, only if monthly statistics). Actual month. The first row in the table contains the first month of simulation, and the last row contains the last month of the simulation. Intermediate rows contain the simulated months in growing order, repeating from 1 to 12 each year.
- No. of events: (Optional, only for individual locations). Count of events identified in the current year/month.
- Total Duration: (Optional, only for individual locations). Accumulated duration of all events in the current year/month.
- Total Volume: (Optional, if volume statistics are available and selected for this type of location). Accumulated volume for all events in the current year/month.
- Total mass (Component xx): (Optional, if pollutant mass statistics are available and selected for this type of location). Accumulated pollutant mass for all events in the current year/month. NOTE: This column shall be repeated for each AD component included in the simulation.