Displaying Yearly/Monthly Statistics Bar Charts
Annual/monthly statistics may be displayed as bar charts.
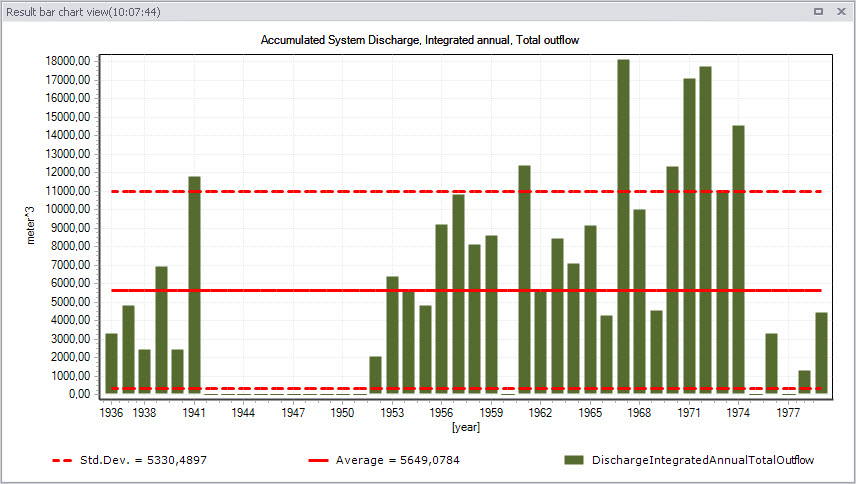
Figure: Chronological yearly statistics displayed as bar chart
X-axis: Year axis. Yearly values are shown in case of yearly statistics. In case of monthly statistics, major tick marks are shown for years and minor tick marks for months.
Y-axis: Values axis showing with units according to type of variable for accumulated values.
Statistical information: The graph also displays the average annual/monthly accumulated (or duration) values, as well as standard deviation values plotted as line series on the graph.
The chart appearance (e.g. bar colours) may be customized.